


Our team has over 7,000,000 traders!
Every day we work together to improve trading. We get high results and move forward.
Recognition by millions of traders all over the world is the best appreciation of our work! You made your choice and we will do everything it takes to meet your expectations!
We are a great team together!
InstaSpot. Proud to work for you!


Actor, UFC 6 tournament champion and a true hero!
The man who made himself. The man that goes our way.
The secret behind Taktarov's success is constant movement towards the goal.
Reveal all the sides of your talent!
Discover, try, fail - but never stop!
InstaSpot. Your success story starts here!

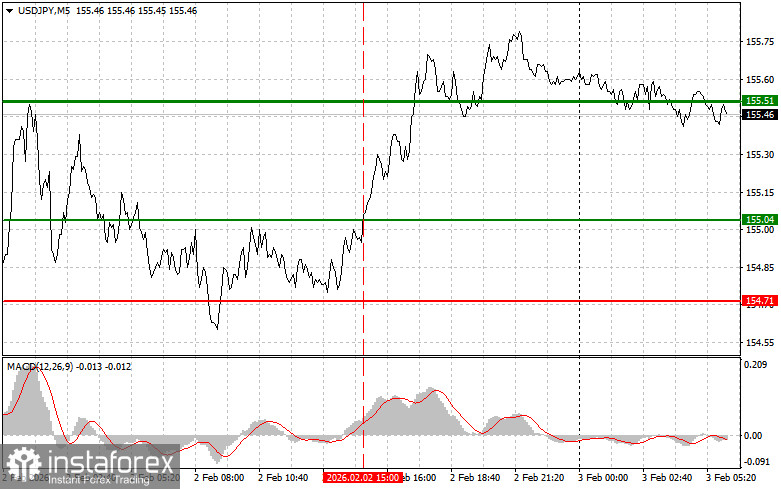
The test of the 155.04 price coincided with the MACD indicator moving significantly above the zero mark, which limited the pair's upside potential. For this reason, I did not buy the dollar.
The positive ISM Index report in the United States yesterday, showing growth in the manufacturing sector above the key 50 mark, triggered a new influx of dollar purchases and a sell-off of the Japanese yen. Despite all the rate manipulations last week, the yen has once again begun to decline sharply against the US dollar, and it is currently difficult to imagine what could reverse this trend. The good ISM data served as evidence of the strength of the US economy. The ISM Index, an important barometer of business activity, exceeded forecasts, signaling growth in the manufacturing sector and thereby creating favorable conditions for the dollar's rise and the yen's weakening.
Today, data on changes in Japan's monetary base was released, but it did not affect the pair. The yen continued to demonstrate weakness. Attention may have shifted to upcoming political events that could clarify the country's future economic policy. Domestic factors, such as inflation levels and consumer spending, also play an important role in shaping market sentiment. It is also necessary to consider external factors, such as Japan's trade relationships with other countries. In the short term, the yen is likely to continue its decline against the dollar, as there are currently no significant reasons for a change in trend.
As for the intraday strategy, I will focus more on implementing scenarios No. 1 and No. 2.
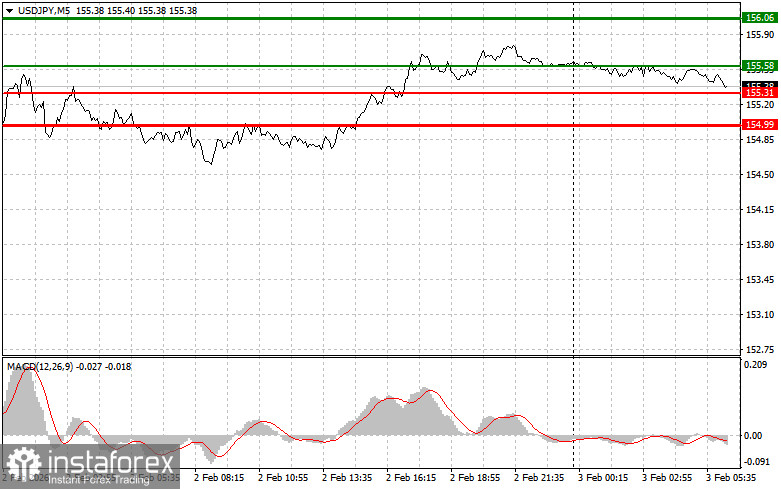
Scenario #1: I plan to buy USD/JPY today when it reaches around 155.58 (green line on the chart), with a target at 156.06 (thicker green line on the chart). At 156.06, I intend to exit the long positions and open shorts in the opposite direction (expecting a 30-35-pip move back from this level). It is best to resume buying the pair on corrections and on serious dips in USD/JPY. Important! Before buying, ensure that the MACD indicator is above the zero mark and just starting to rise from it.
Scenario #2: I also plan to buy USD/JPY today in the case of two consecutive tests of the price at 155.31 when the MACD indicator is in the oversold area. This will limit the pair's downside potential and lead to an upward market reversal. Growth can be expected towards the opposite levels of 155.58 and 156.06.
Scenario #1: I plan to sell USD/JPY today only after updating the 155.31 level (red line on the chart), which will trigger a rapid decline in the pair. The key target for sellers will be the 154.99 level, where I plan to exit the shorts and immediately buy in the opposite direction (expecting a move of 20-25 pips back from this level). It is better to sell as high as possible. Important! Before selling, ensure the MACD indicator is below the zero mark and just beginning its descent.
Scenario #2: I also plan to sell USD/JPY today if there are two consecutive tests of 155.58 while the MACD indicator is in the overbought area. This will limit the pair's upward potential and lead to a market reversal downward. A decline can be expected towards the opposite levels of 155.31 and 154.99.
The thin green line represents the entry price at which one can buy the trading instrument;
The thick green line represents the approximate price where one can set Take Profit or secure profits, as further growth above this level is unlikely;
The thin red line represents the entry price at which one can sell the trading instrument;
The thick red line represents the approximate price where one can set Take Profit or secure profits, as further decline below this level is unlikely;
The MACD indicator: when entering the market, it is important to consider overbought and oversold zones.
Important: Beginner traders in the Forex market should be very careful when making entry decisions. It is best to stay out of the market before important fundamental reports are released to avoid getting caught in sharp price fluctuations. If you decide to trade during news releases, always set stop orders to minimize losses. Without setting stop orders, you can quickly lose your entire deposit, especially if you do not use money management and trade large volumes.
And remember, for successful trading, it is essential to have a clear trading plan, like the one presented above. Making spontaneous trading decisions based on the current market situation is inherently a losing strategy for an intraday trader.
*The market analysis posted here is meant to increase your awareness, but not to give instructions to make a trade.
InstaSpot analytical reviews will make you fully aware of market trends! Being an InstaSpot client, you are provided with a large number of free services for efficient trading.


