


The legend in the InstaSpot team!
Legend! You think that's bombastic rhetoric? But how should we call a man, who became the first Asian to win the junior world chess championship at 18 and who became the first Indian Grandmaster at 19? That was the start of a hard path to the World Champion title for Viswanathan Anand, the man who became a part of history of chess forever. Now one more legend in the InstaSpot team!


Borussia is one of the most titled football clubs in Germany, which has repeatedly proved to fans: the spirit of competition and leadership will certainly lead to success. Trade in the same way that sports professionals play the game: confidently and actively. Keep a "pass" from Borussia FC and be in the lead with InstaSpot!

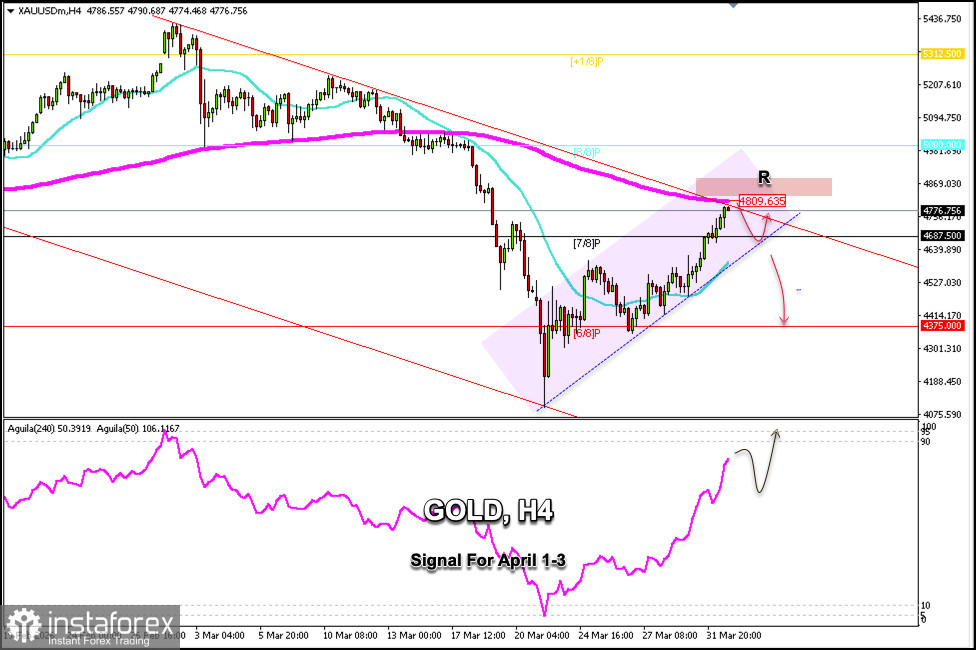
Gold is trading around $4,776, reaching resistance levels. This zone coincides with the upper band of the downtrend channel formed since February 26. The 200-day EMA is located around this area at $4,809, so gold may struggle to continue rising above this zone.
If gold reaches $4,809 or falls below this zone, it could be seen as an opportunity to open short positions, with targets at $4,687. We could even expect a correction to the 23.6% Fibonacci level around $4,620, a level that coincides with the 21-day SMA.
If bullish momentum prevails, a technical correction toward the 7/8 Murray level could be considered an opportunity to buy around $4,687. This level could allow us to open long positions with targets at $4,809. The instrument could even reach the psychological level of $5,000 around the 8/8 Murray level.
The Eagle indicator is reaching overbought levels, so as long as the metal trades below $4,809, we will look for opportunities to sell with a target at $4,687.
A decisive break above the 200 EMA could be seen as an opportunity to open long positions with targets at $5,000.
Our trading plan for the coming hours is to sell below the 200 EMA, with targets at $4,730, $4,700, and $4,687.
*The market analysis posted here is meant to increase your awareness, but not to give instructions to make a trade.
InstaSpot analytical reviews will make you fully aware of market trends! Being an InstaSpot client, you are provided with a large number of free services for efficient trading.


