


ہمارے ٹیم میں 7000000 سے ذائد تاجران شامل ہیں
ہم تجارت کی بہتری کے لئے ہر روز اکھٹے کام کرتے ہیں اور بہترین نتائج حاصل کرتے ہوئے آگے کی جانب بڑھتے ہیں
دُنیا بھر سے سے لاکھوں ہمارے بہترین کام کو سند عطاء کرتے ہیں آپ اپنا انتحاب کریں باقی ہم آپ کی توقعات پر پورا اترنے کے لئے اپنی بہترین کوشش کریں گے
ہم مل کر ایک بہترین ٹیم بناتے ہیں
انسٹا فاریکس آپ سے کام کرتے ہوئے فخر محسوس کرتا ہے


ایکٹر - یو سی ایف 6 ٹورنامنٹ چیمپین اور واقعی ہیرو
ایک فرد کے جس نے اپنا آپ منوایا ہے وہ فرد کہ جو ہماری راہ پر چلا ہے.
ٹکٹا روو کی کامیابی کا راز یہ ہے کہ وہ اپنے اہداف کی جانب مسلسل بڑھتا رہتا ہے
اپنے ہنر یا ٹیلنٹ کے تمام پہلو آشکار کررہے ہیں
پہچانیں ، کوشش کریں ، ناکام ہوں لیکن کبھی نہ رُکیں
انسٹا فاریکس آپ کی کامیابی کی کہاں یہاں سے شروع ہوتی ہے

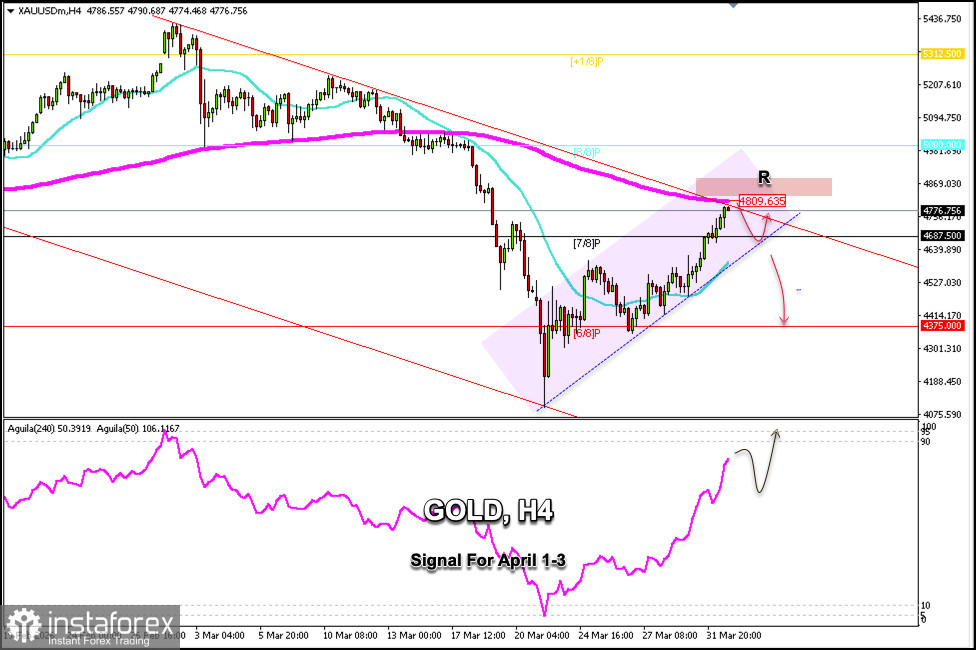
Gold is trading around $4,776, reaching resistance levels. This zone coincides with the upper band of the downtrend channel formed since February 26. The 200-day EMA is located around this area at $4,809, so gold may struggle to continue rising above this zone.
If gold reaches $4,809 or falls below this zone, it could be seen as an opportunity to open short positions, with targets at $4,687. We could even expect a correction to the 23.6% Fibonacci level around $4,620, a level that coincides with the 21-day SMA.
If bullish momentum prevails, a technical correction toward the 7/8 Murray level could be considered an opportunity to buy around $4,687. This level could allow us to open long positions with targets at $4,809. The instrument could even reach the psychological level of $5,000 around the 8/8 Murray level.
The Eagle indicator is reaching overbought levels, so as long as the metal trades below $4,809, we will look for opportunities to sell with a target at $4,687.
A decisive break above the 200 EMA could be seen as an opportunity to open long positions with targets at $5,000.
Our trading plan for the coming hours is to sell below the 200 EMA, with targets at $4,730, $4,700, and $4,687.
*تعینات کیا مراد ہے مارکیٹ کے تجزیات یہاں ارسال کیے جاتے ہیں جس کا مقصد آپ کی بیداری بڑھانا ہے، لیکن تجارت کرنے کے لئے ہدایات دینا نہیں.
InstaSpot analytical reviews will make you fully aware of market trends! Being an InstaSpot client, you are provided with a large number of free services for efficient trading.


