


The legend in the InstaSpot team!
Legend! You think that's bombastic rhetoric? But how should we call a man, who became the first Asian to win the junior world chess championship at 18 and who became the first Indian Grandmaster at 19? That was the start of a hard path to the World Champion title for Viswanathan Anand, the man who became a part of history of chess forever. Now one more legend in the InstaSpot team!


Borussia is one of the most titled football clubs in Germany, which has repeatedly proved to fans: the spirit of competition and leadership will certainly lead to success. Trade in the same way that sports professionals play the game: confidently and actively. Keep a "pass" from Borussia FC and be in the lead with InstaSpot!

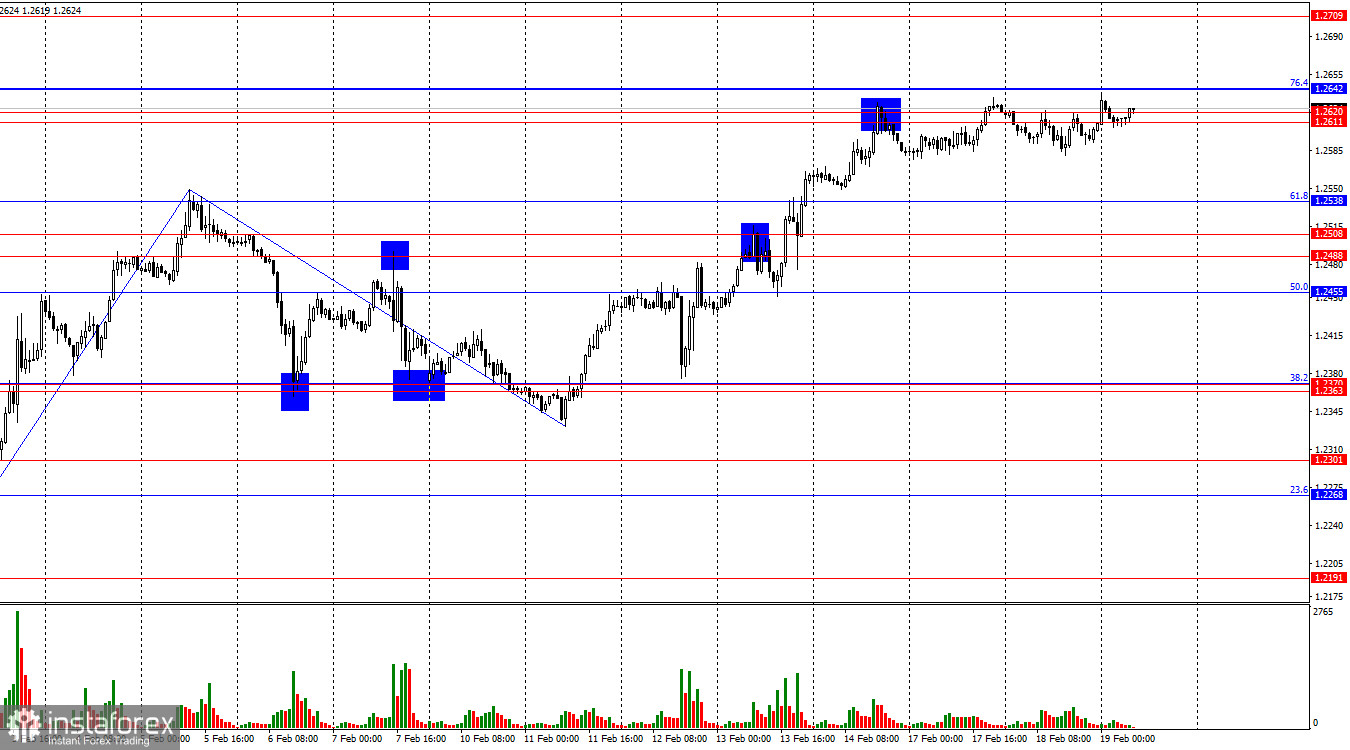
On the hourly chart, GBP/USD continued to hover around the resistance zone of 1.2611 – 1.2620 on Tuesday. A rebound from 1.2611 – 1.2642 would favor the U.S. dollar and signal a decline toward the 61.8% Fibonacci retracement level at 1.2538 and the support zone of 1.2488 – 1.2508. A breakout above 1.2642 would increase the likelihood of further growth toward 1.2709.
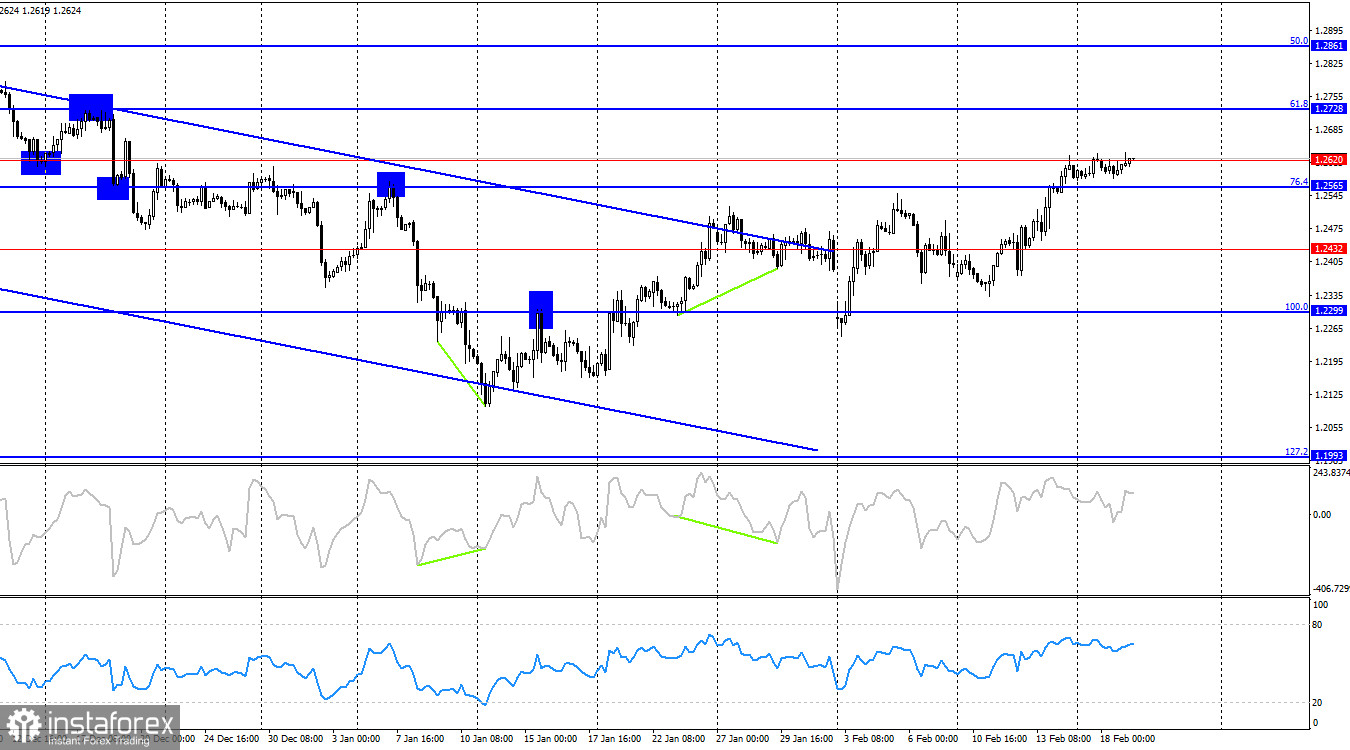
On the 4-hour chart, GBP/USD remains in an uptrend and has entered the 1.2565 – 1.2620 resistance zone. If bulls continue to push higher without fresh fundamental support, the pound could extend gains further. However, given the current lack of supporting macroeconomic data, technical analysis holds greater weight for decision-making in the market.
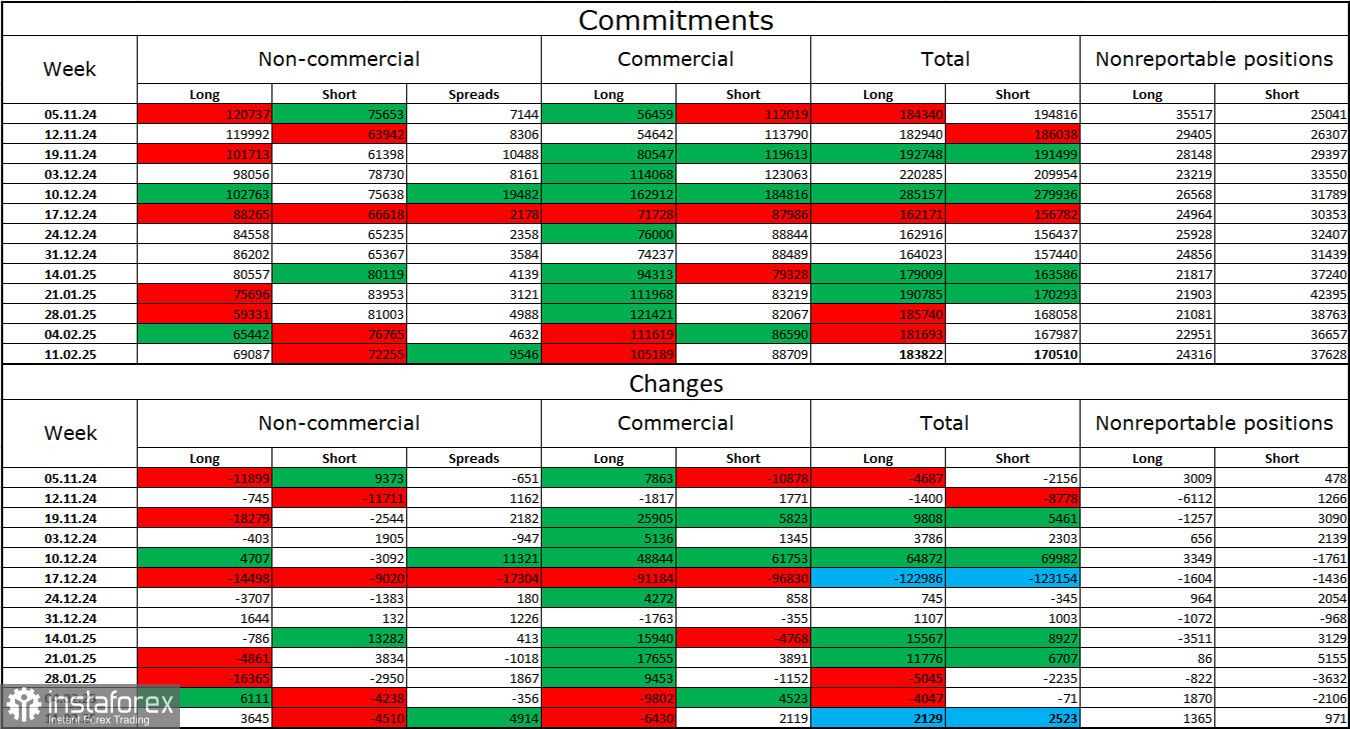
The latest COT report indicates that sentiment among non-commercial traders has become less bearish over the past week. The number of long positions held by speculative traders increased by 3,645, while short positions decreased by 4,510. Bulls have lost any significant advantage, but bears have also struggled to strengthen their position. The gap between long and short positions still favors the bears: 69,000 vs. 72,000.
I still see downward risks for the pound. COT data signals a gradual strengthening of bearish sentiment. Over the past three months, long positions have fallen from 120,000 to 69,000, while short positions have remained relatively stable, decreasing slightly from 75,000 to 72,000. I expect institutional players to gradually offload long positions or increase short exposure, as most bullish catalysts for GBP/USD have already played out. While the technical picture currently supports an uptrend, corrections should not be ruled out.
Among these, the UK inflation report has already been released, and its impact on market sentiment is fading. The remaining US data is of lower significance and unlikely to cause major volatility.
Sell positions can be considered if the pair rebounds from 1.2611 – 1.2642 on the hourly chart, with targets at 1.2538 and 1.2508.
Buy positions were viable after a breakout above 1.2363 – 1.2370, with a target of 1.2488 – 1.2508. This target has already been reached, so I am not currently considering new buy trades.
Fibonacci retracement levels are drawn from 1.2809 – 1.2100 on the hourly chart and from 1.2299 – 1.3432 on the 4-hour chart.
*The market analysis posted here is meant to increase your awareness, but not to give instructions to make a trade.
InstaSpot analytical reviews will make you fully aware of market trends! Being an InstaSpot client, you are provided with a large number of free services for efficient trading.


