


Nella nostra squadra ci sono più di 7.000.000 trader! Ogni giorno ci impegniamo a far sì che il trading migliori. Conseguiamo grandi risultati e ci muoviamo in avanti.
Il riconoscimento da parte di milioni di trader in tutto il mondo rappresenta l'alta valutazione della nostra attività! Voi avete fatto la vostra scelta e noi faremo la nostra al fine di soddisfare le vostre aspettative!
Assieme siamo una grande squadra!
InstaSpot. Siamo orgogliosi di lavorare per voi!


Attore, campione del mondo di lotta libera e semplicemente un vero maciste russo! Persona venuta dal nulla. Persona che rispecchia i nostri obiettivi. Il segreto del successo di Taktarov consiste nel mirare continuamente al suo scopo.
Dischiudi anche tu tutti gli aspetti del tuo talento! Impara, prova, sbaglia, ma non fermarti!
InstaSpot - la storia delle tue vittorie inizia qui!

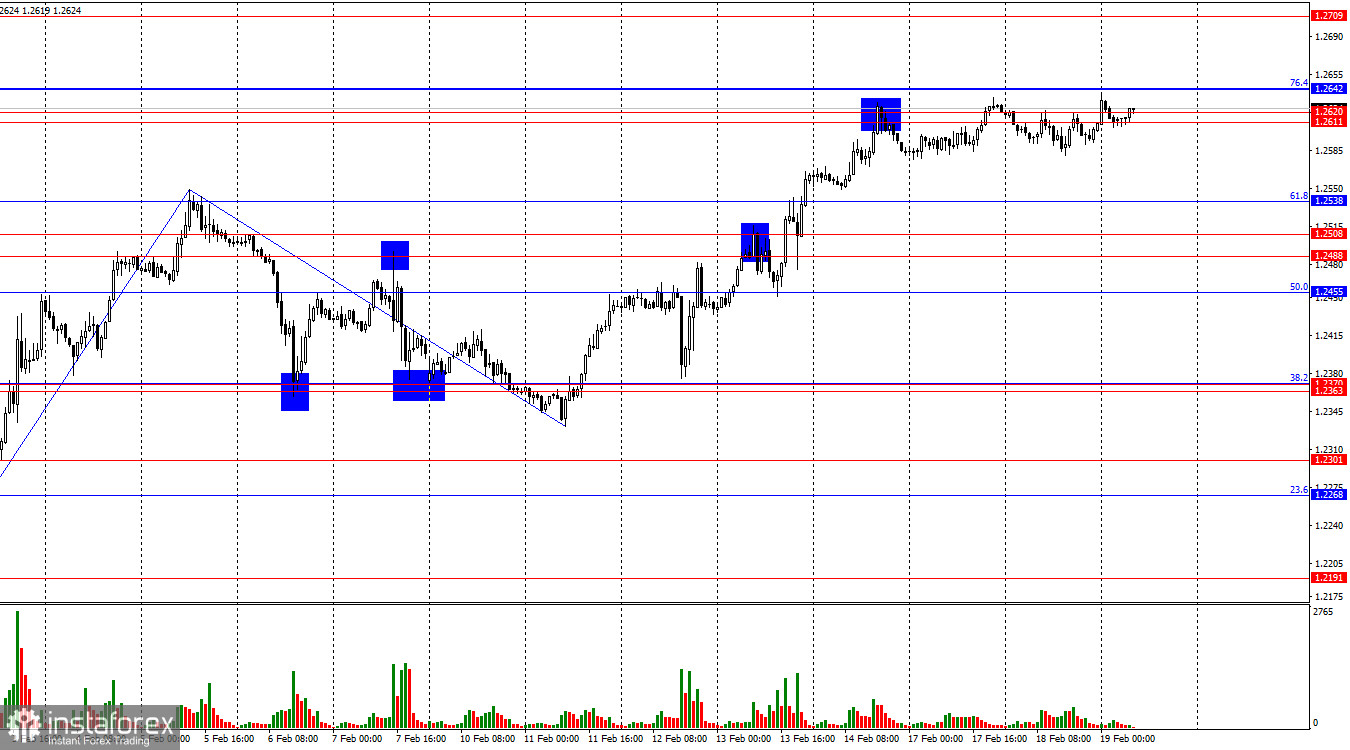
On the hourly chart, GBP/USD continued to hover around the resistance zone of 1.2611 – 1.2620 on Tuesday. A rebound from 1.2611 – 1.2642 would favor the U.S. dollar and signal a decline toward the 61.8% Fibonacci retracement level at 1.2538 and the support zone of 1.2488 – 1.2508. A breakout above 1.2642 would increase the likelihood of further growth toward 1.2709.
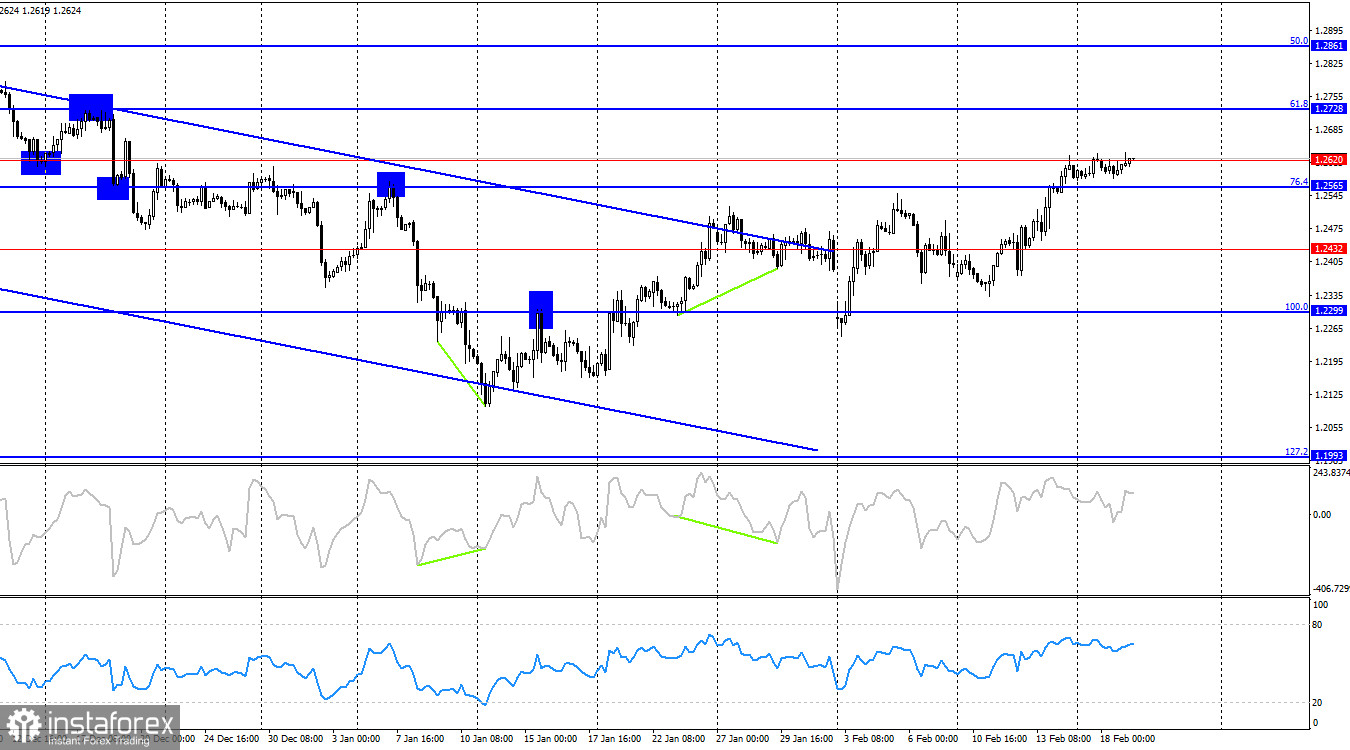
On the 4-hour chart, GBP/USD remains in an uptrend and has entered the 1.2565 – 1.2620 resistance zone. If bulls continue to push higher without fresh fundamental support, the pound could extend gains further. However, given the current lack of supporting macroeconomic data, technical analysis holds greater weight for decision-making in the market.
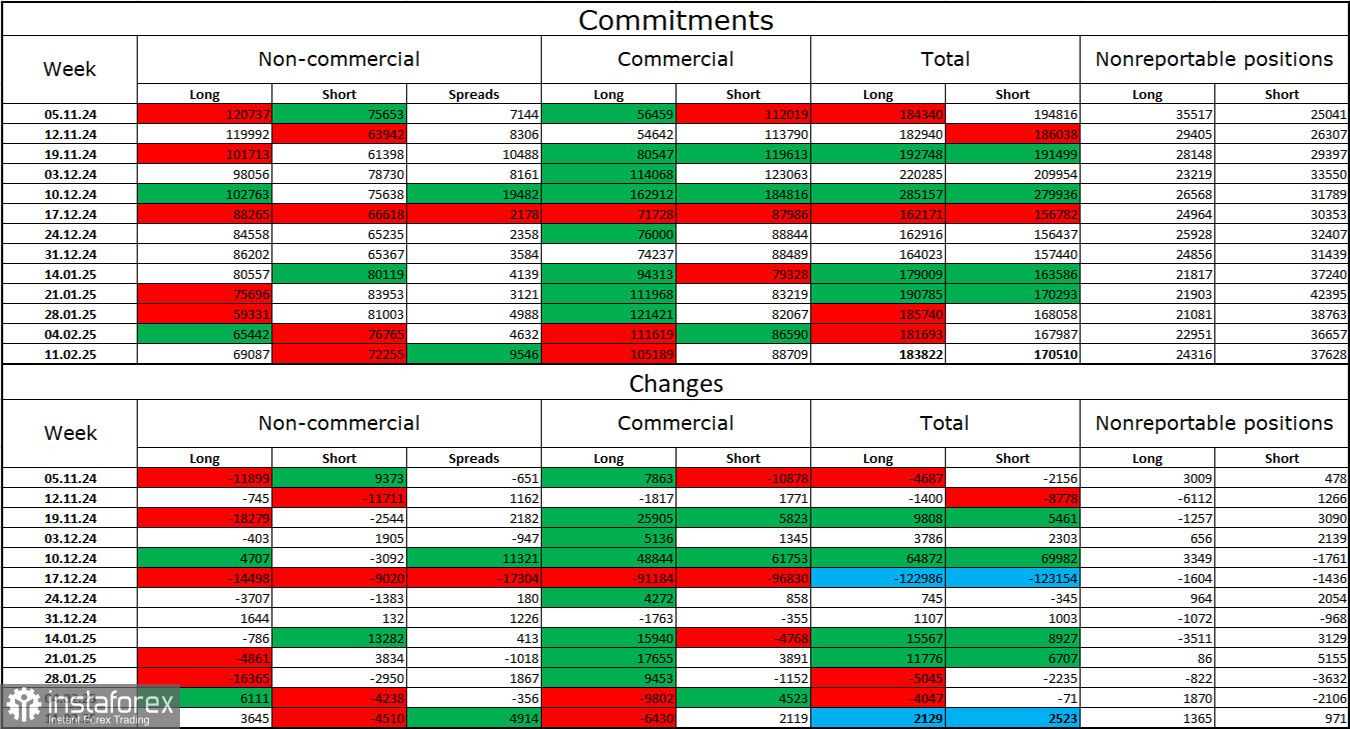
The latest COT report indicates that sentiment among non-commercial traders has become less bearish over the past week. The number of long positions held by speculative traders increased by 3,645, while short positions decreased by 4,510. Bulls have lost any significant advantage, but bears have also struggled to strengthen their position. The gap between long and short positions still favors the bears: 69,000 vs. 72,000.
I still see downward risks for the pound. COT data signals a gradual strengthening of bearish sentiment. Over the past three months, long positions have fallen from 120,000 to 69,000, while short positions have remained relatively stable, decreasing slightly from 75,000 to 72,000. I expect institutional players to gradually offload long positions or increase short exposure, as most bullish catalysts for GBP/USD have already played out. While the technical picture currently supports an uptrend, corrections should not be ruled out.
Among these, the UK inflation report has already been released, and its impact on market sentiment is fading. The remaining US data is of lower significance and unlikely to cause major volatility.
Sell positions can be considered if the pair rebounds from 1.2611 – 1.2642 on the hourly chart, with targets at 1.2538 and 1.2508.
Buy positions were viable after a breakout above 1.2363 – 1.2370, with a target of 1.2488 – 1.2508. This target has already been reached, so I am not currently considering new buy trades.
Fibonacci retracement levels are drawn from 1.2809 – 1.2100 on the hourly chart and from 1.2299 – 1.3432 on the 4-hour chart.
*La presente analisi del mercato ha un carattere esclusivamente informativo e non rappresenta una guida per l`effettuazione di una transazione.
Le recensioni analitiche di InstaSpot ti renderanno pienamente consapevole delle tendenze del mercato! Essendo un cliente InstaSpot, ti viene fornito un gran numero di servizi gratuiti per il trading efficiente.


