


Our team has over 7,000,000 traders!
Every day we work together to improve trading. We get high results and move forward.
Recognition by millions of traders all over the world is the best appreciation of our work! You made your choice and we will do everything it takes to meet your expectations!
We are a great team together!
InstaSpot. Proud to work for you!


Actor, UFC 6 tournament champion and a true hero!
The man who made himself. The man that goes our way.
The secret behind Taktarov's success is constant movement towards the goal.
Reveal all the sides of your talent!
Discover, try, fail - but never stop!
InstaSpot. Your success story starts here!

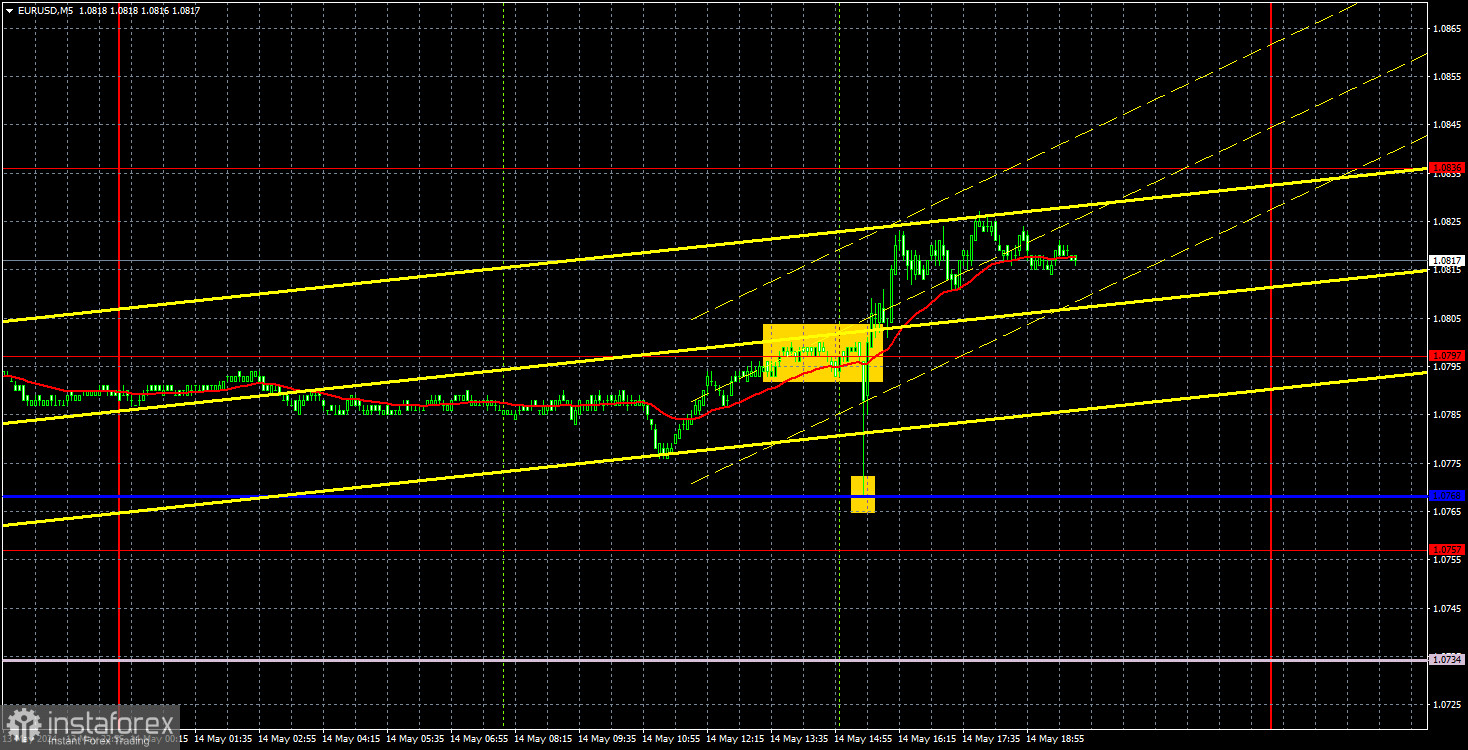
The EUR/USD currency pair showed low volatility and moved slightly higher for the second day of the week, as this has become customary. In general, the price moves the same way every day – upwards but in a weak manner. The euro did not necessarily have strong reasons to rise on Tuesday. In the morning, traders ignored the reports from Germany and the Eurozone, although they showed relatively good results. However, these were secondary data, as we mentioned yesterday. On the other hand, the US Producer Price Index (PPI) triggered a storm of emotions in the market. It's entirely unclear what the market's intentions were. Initially, the dollar sharply rose, followed by an even stronger decline.
In order to understand what happened, let's look at the report itself. The annual PPI was 2.2% in April, the same as the previous month and as forecasted by experts. So far, nothing extraordinary. On a monthly basis, the PPI was 0.5% against forecasts of 0.2-0.3%. The report exceeded forecasts, and producer inflation rose more than expected, which should negatively impact inflation, making it a bullish factor for the dollar. The dollar initially strengthened after the report, but then it eventually fell. Therefore, we conclude that the market is not inclined to buy the dollar even with a favorable macroeconomic background, similar to the situation with the British pound.
There were several trading signals on Tuesday. Traders could either trade off the bounce from the Kijun-sen line or the break above the 1.0797 level. In both cases, a long position would have brought relatively good profit. However, volatility was low, so it was difficult to expect substantial profit.
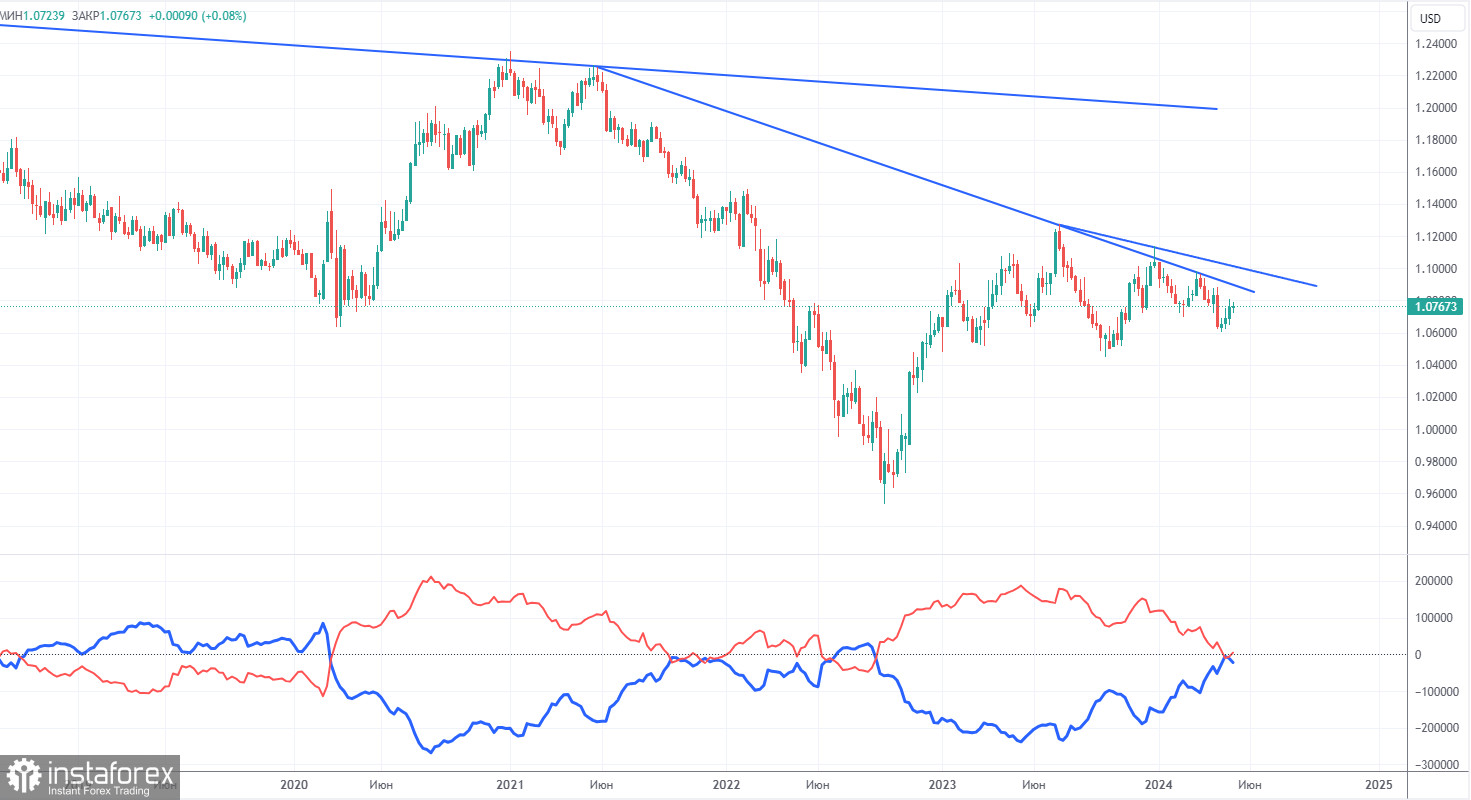
The latest COT report is dated May 7. The net position of non-commercial traders has been bullish for quite some time, but now the situation has finally changed. The net position of non-commercial traders (red line) has been decreasing in recent months, while that of commercial traders (blue line) has been increasing. This shows that market sentiment is turning bearish, as speculators increasingly sell the euro. Currently, their positions coincide in terms of volume. We don't see any fundamental factors that can support the euro's strength, while technical analysis also suggests a downtrend. Three descending trend lines on the weekly chart indicate that there's a good chance of continuing the decline.
The red and blue lines have crossed, and now bears may have a significant advantage. So we strongly believe that the euro will fall further. During the last reporting week, the number of long positions for the non-commercial group increased by 3,400, while the number of short positions decreased by 7,900. Accordingly, the net position increased by 12,300. Overall, both the euro and the net position continue to decline. The number of buy contracts is only higher than the number of sell contracts among non-commercial traders by 4,000.
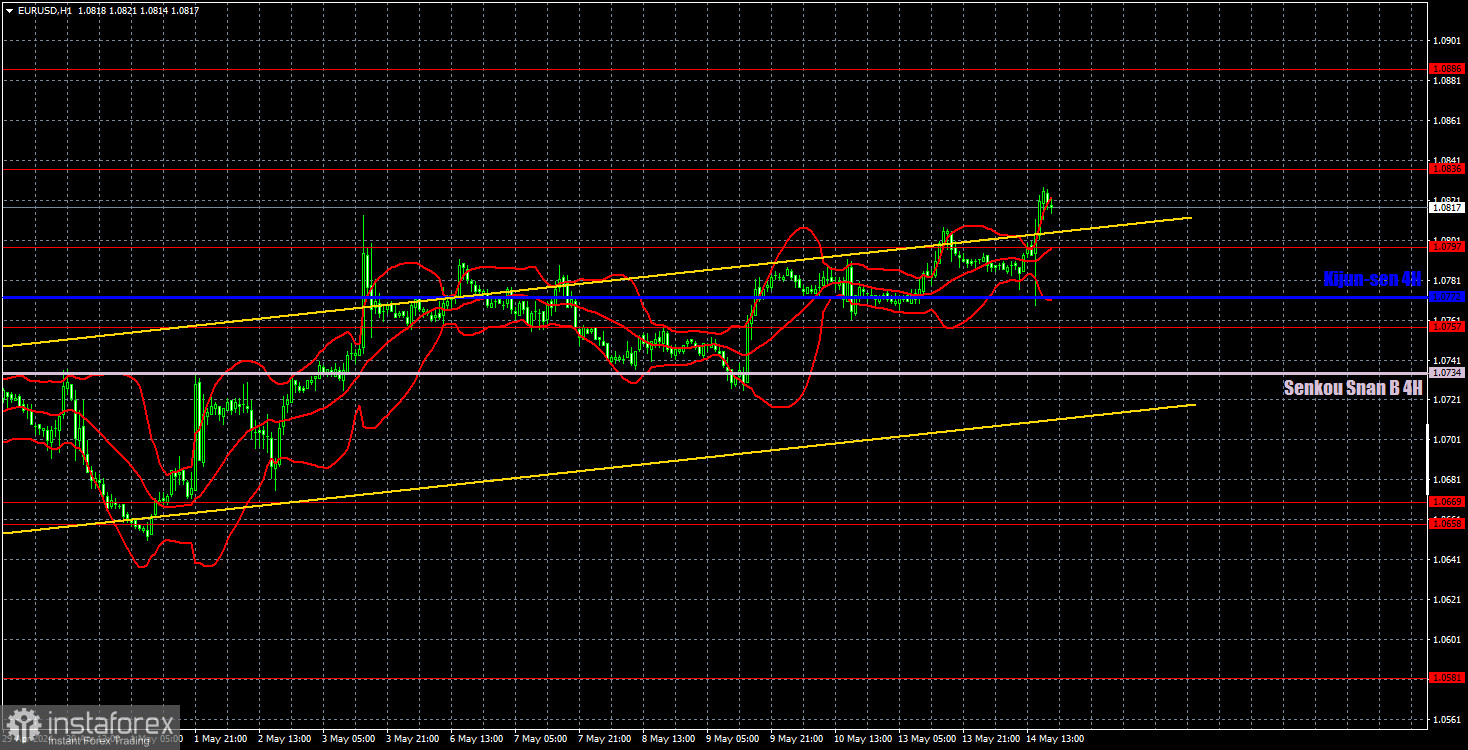
On the 1-hour chart, the EUR/USD pair has been going through a weak bullish correction against a global downward trend for three weeks now, and it spent the last week absolutely flat. Since expectations for a Federal Reserve rate cut in 2024 have significantly decreased, the US currency should rise in the medium term. We still expect the price to consolidate below the ascending channel, and after that traders may consider selling again. Targets in the area of 1.00-1.04 remain relevant.
On May 15, we highlight the following levels for trading: 1.0530, 1.0581, 1.0658-1.0669, 1.0757, 1.0797, 1.0836, 1.0886, 1.0935, 1.1006, 1.1092, as well as the Senkou Span B (1.0734) and Kijun-sen (1.0772) lines. The Ichimoku indicator lines can move during the day, so this should be taken into account when identifying trading signals. Don't forget to set a Stop Loss to breakeven if the price has moved in the intended direction by 15 pips. This will protect you against potential losses if the signal turns out to be false.
On Wednesday, the European Union will release relatively important reports on GDP (second estimate) and industrial production. We do not expect a strong market reaction to these data, as both reports are not crucial. But the US will release a crucial inflation report and a less important one on retail sales. We expect the main movements in the second half of the day.
Support and resistance levels are thick red lines near which the trend may end. They do not provide trading signals;
The Kijun-sen and Senkou Span B lines are the lines of the Ichimoku indicator, plotted to the 1H timeframe from the 4H one. They provide trading signals;
Extreme levels are thin red lines from which the price bounced earlier. They provide trading signals;
Yellow lines are trend lines, trend channels, and any other technical patterns;
Indicator 1 on the COT charts is the net position size for each category of traders;
*The market analysis posted here is meant to increase your awareness, but not to give instructions to make a trade.
InstaSpot analytical reviews will make you fully aware of market trends! Being an InstaSpot client, you are provided with a large number of free services for efficient trading.


