


Our team has over 7,000,000 traders!
Every day we work together to improve trading. We get high results and move forward.
Recognition by millions of traders all over the world is the best appreciation of our work! You made your choice and we will do everything it takes to meet your expectations!
We are a great team together!
InstaSpot. Proud to work for you!


Actor, UFC 6 tournament champion and a true hero!
The man who made himself. The man that goes our way.
The secret behind Taktarov's success is constant movement towards the goal.
Reveal all the sides of your talent!
Discover, try, fail - but never stop!
InstaSpot. Your success story starts here!

On Monday, EUR/USD managed to exhibit a minor corrective growth. The upward movement was due to technical reasons, as there was no fundamental or macroeconomic background. More precisely, there were scheduled speeches by Christine Lagarde, representatives of the European Central Bank, Panetta and Lane, and in the US, representatives of the Federal Reserve, Goolsbee and Bostic. However, none of them provided the market with information that could provoke a strong reaction or change traders' sentiment.
Perhaps the highlight of the day was Bostic's statement that he expects only one rate cut by the Fed in 2024. Recall that we have repeatedly stated before that the Fed may ease monetary policy much less than the market expects. We strongly doubt even that the Fed will lower rates in June. Although the market, according to the FedWatch tool, continues to believe in such an outcome. But, as we have already said, yesterday the fundamental background was weak and it did not affect the pair's movement. As for the long-term perspective, we expect nothing but further growth for the dollar. We continue to receive signals from the Fed that policy easing may start much later and could be much softer than most market participants expect. And this is a bullish factor for the US dollar.
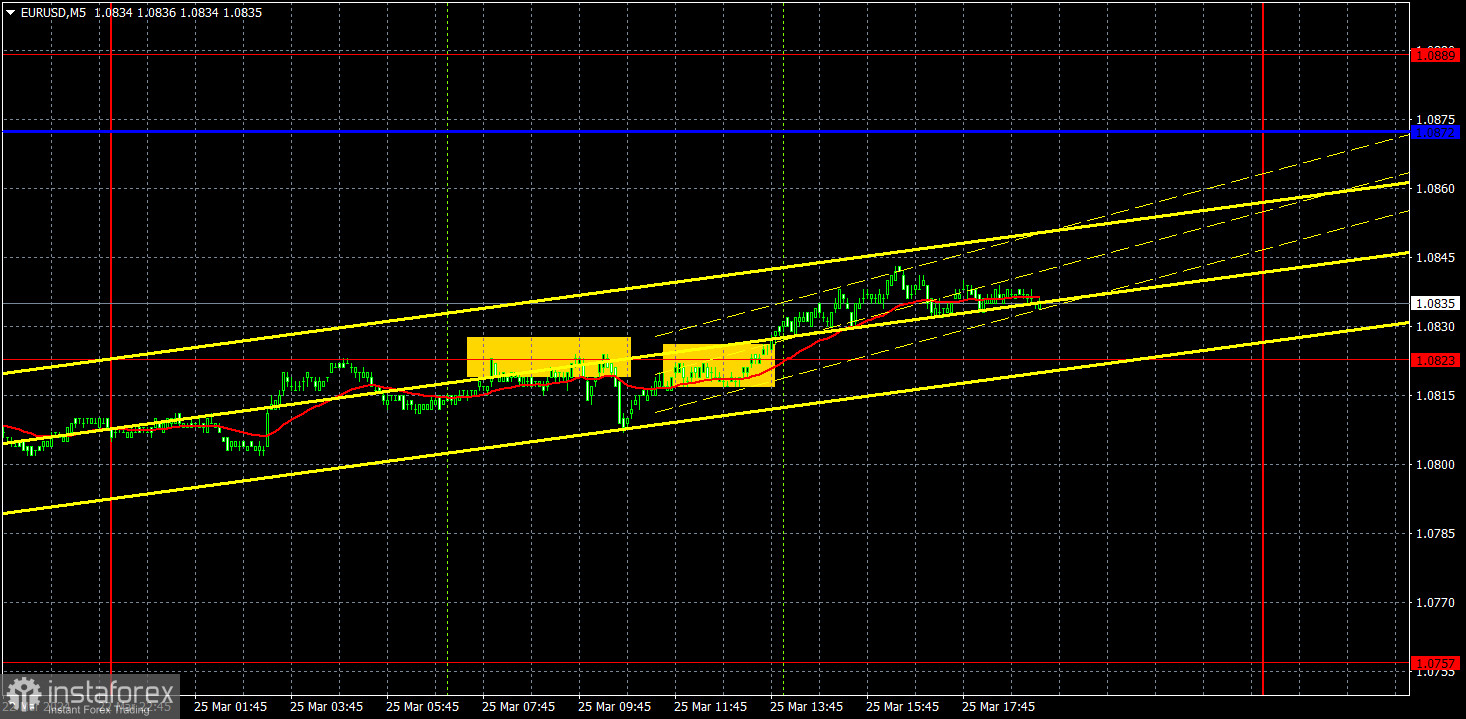
There were few trading signals on Monday as volatility was weak. Initially, the pair bounced off the level of 1.0823 three times but managed to fall by only 10 pips. Then there was a breakthrough of this level, and the price managed to climb by another 10 pips. Once again, we remind you that the overall volatility of the EUR/USD pair is currently very low. And if there is no movement in the market, it is extremely difficult to rely on strong signals and good profit.
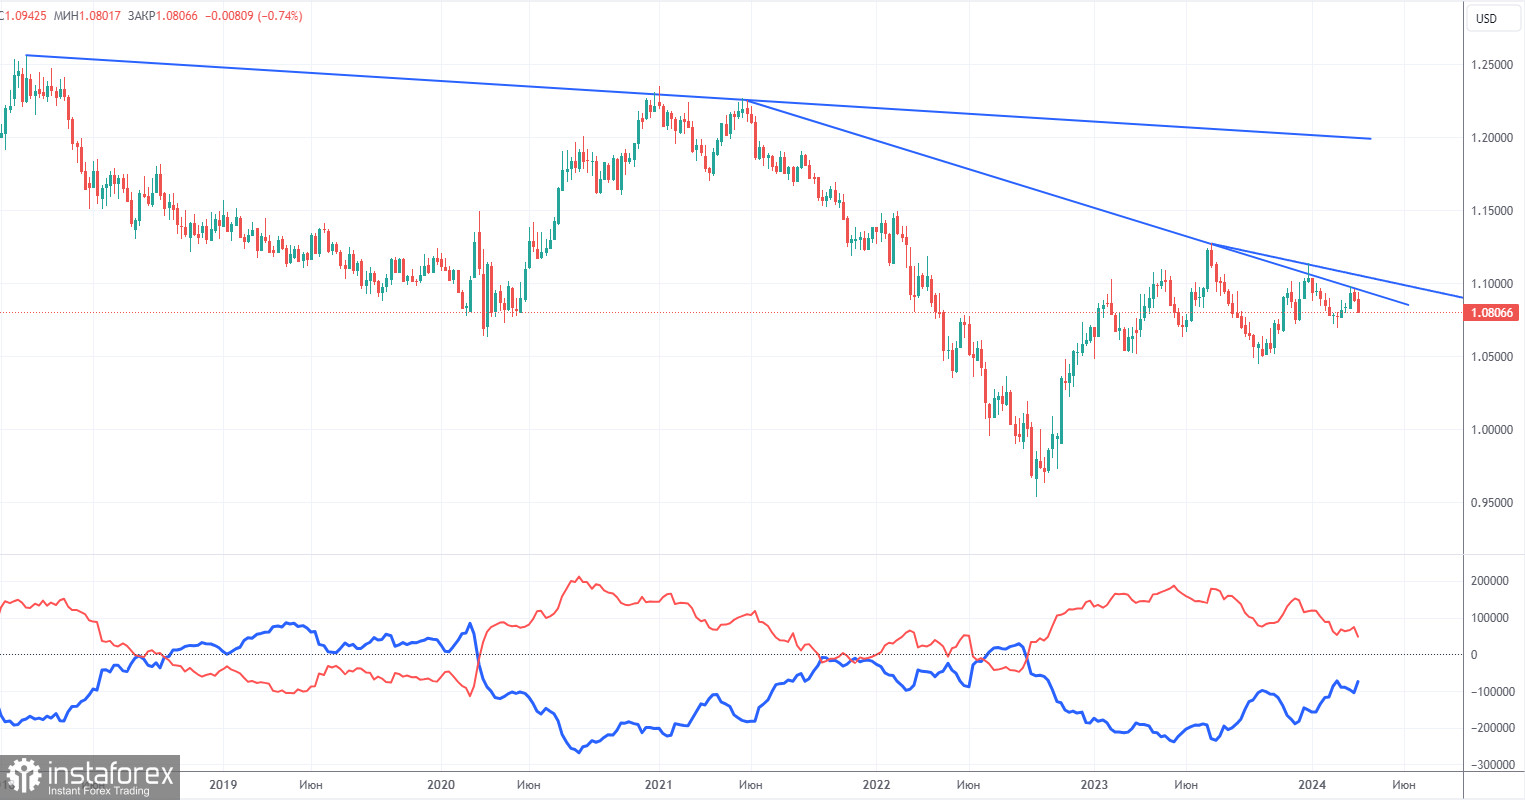
The latest COT report is dated March 19. The net position of non-commercial traders has been bullish for quite some time. Basically, the number of long positions in the market is higher than the number of short positions. However, at the same time, the net position of non-commercial traders has been decreasing in recent months, while that of commercial traders has been increasing. This shows that market sentiment is turning bearish, as speculators increase the volume of short positions on the euro. We don't see any fundamental factors that can support the euro's growth in the long term, while technical analysis also suggests a downtrend. Three descending trend lines on the weekly chart indicate that there's a good chance of extending the decline.
At present, the red and blue lines are moving towards each other (indicating a trend reversal after a rise). Therefore, we believe that the euro will fall further. During the last reporting week, the number of long positions for the non-commercial group decreased by 11,600, while the number of short positions increased by 14,400. Accordingly, the net position decreased by 26,000. The number of buy contracts is still higher than the number of sell contracts among non-commercial traders by 48,000 (previously 74,000).
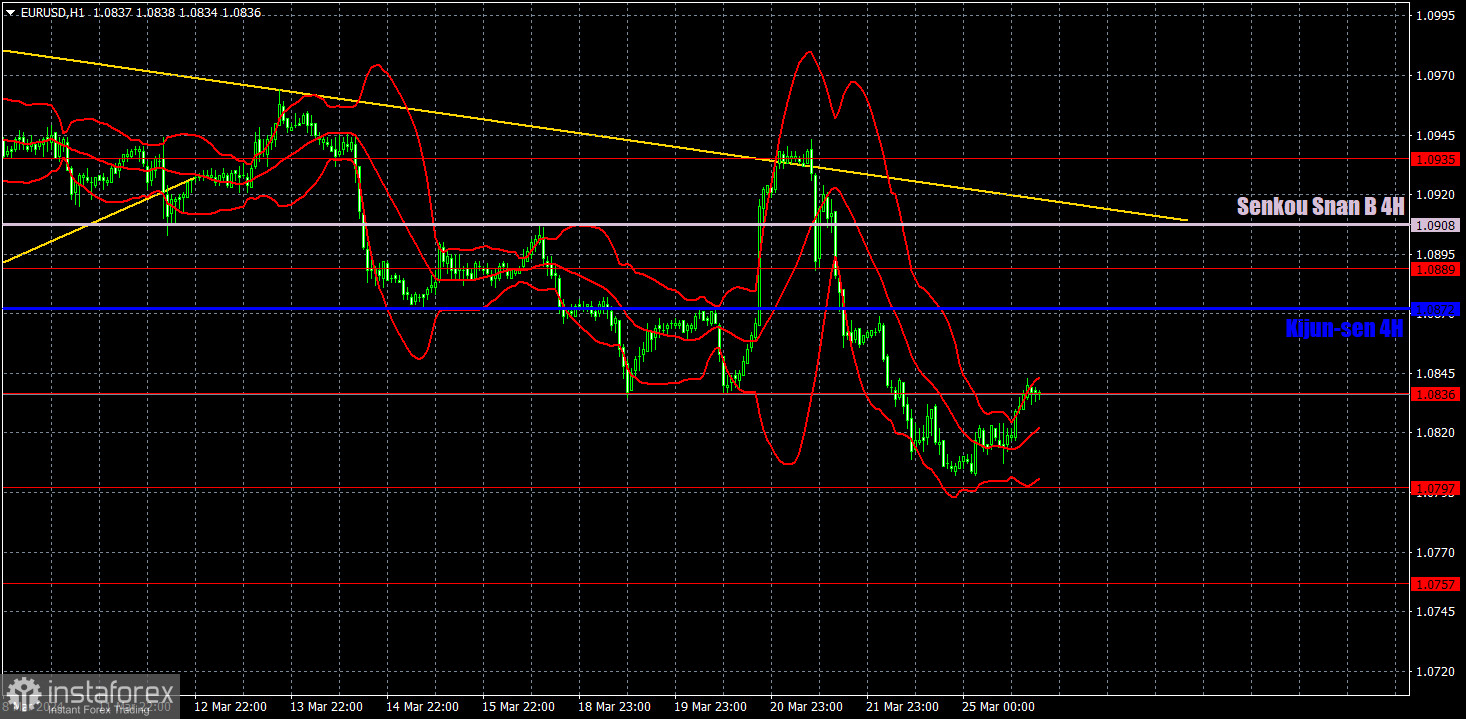
On the 1-hour chart, EUR/USD has started the long-awaited downtrend, which could take the price much lower. The price is below the Ichimoku indicator lines, which gives us reason to expect further downward movement. The descending trendline also supports sellers. The dollar should still rise in almost any case, especially after the "moderately hawkish" FOMC meeting.
On March 26, we highlight the following levels for trading: 1.0530, 1.0581, 1.0658-1.0669, 1.0757, 1.0797, 1.0836, 1.0889, 1.0935, 1.1006, 1.1092, as well as the Senkou Span B (1.0908) and Kijun-sen (1.0872) lines. The Ichimoku indicator lines can move during the day, so this should be taken into account when identifying trading signals. Don't forget to set a Stop Loss to breakeven if the price has moved in the intended direction by 15 pips. This will protect you against potential losses if the signal turns out to be false.
On Tuesday, European Central Bank Chief Economist Philip Lane will speak. Traders will be focusing on the US report on durable goods orders. This is an important report because the goods themselves are quite expensive, and the indicator reflects whether consumers are inclined towards spending or saving. A reading above forecast could boost the dollar.
Support and resistance levels are thick red lines near which the trend may end. They do not provide trading signals;
The Kijun-sen and Senkou Span B lines are the lines of the Ichimoku indicator, plotted to the 1H timeframe from the 4H one. They provide trading signals;
Extreme levels are thin red lines from which the price bounced earlier. They provide trading signals;
Yellow lines are trend lines, trend channels, and any other technical patterns;
Indicator 1 on the COT charts is the net position size for each category of traders;
Indicator 2 on the COT charts is the net position size for the Non-commercial group.
*The market analysis posted here is meant to increase your awareness, but not to give instructions to make a trade.
InstaSpot analytical reviews will make you fully aware of market trends! Being an InstaSpot client, you are provided with a large number of free services for efficient trading.


