


Our team has over 7,000,000 traders!
Every day we work together to improve trading. We get high results and move forward.
Recognition by millions of traders all over the world is the best appreciation of our work! You made your choice and we will do everything it takes to meet your expectations!
We are a great team together!
InstaSpot. Proud to work for you!


Actor, UFC 6 tournament champion and a true hero!
The man who made himself. The man that goes our way.
The secret behind Taktarov's success is constant movement towards the goal.
Reveal all the sides of your talent!
Discover, try, fail - but never stop!
InstaSpot. Your success story starts here!

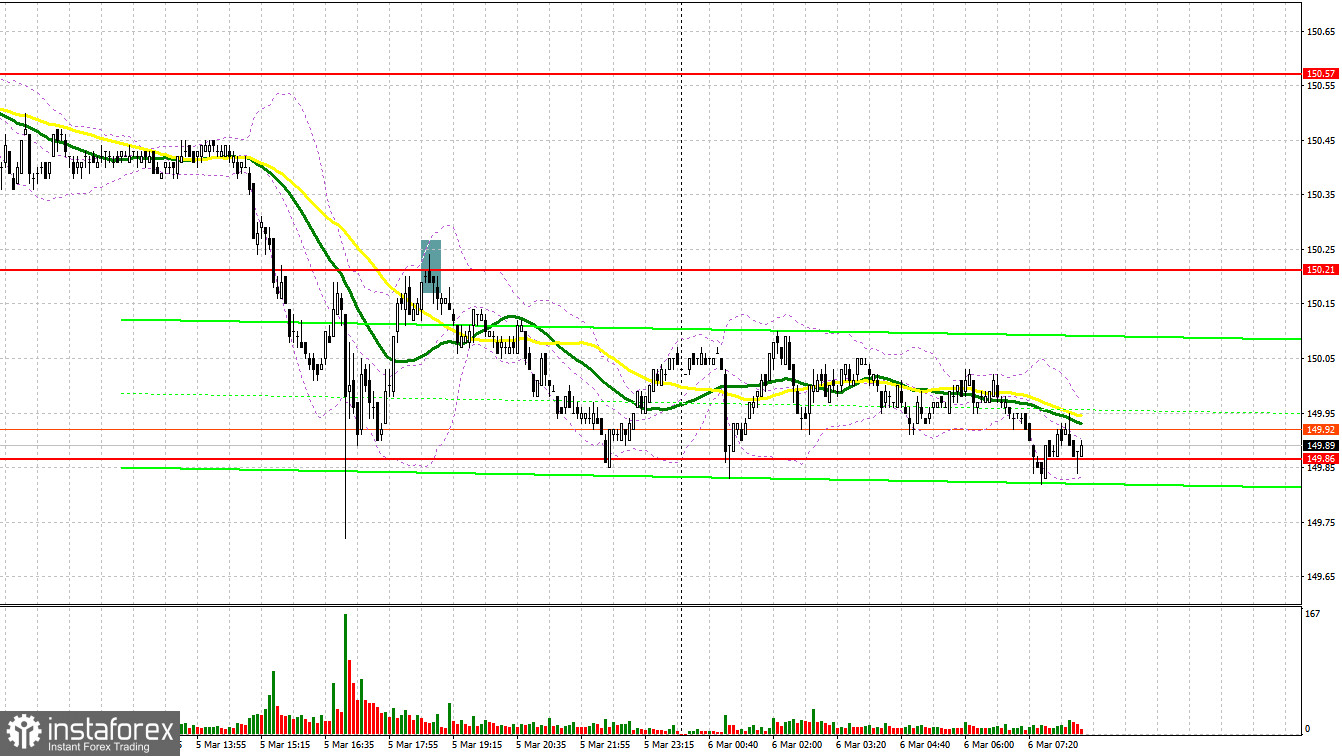
Yesterday, traders received just one signal to enter the market. Let's look at the 5-minute chart and understand what happened there. Earlier, I paid attention to the level of 150.21 to decide when to enter the market. The pair declined, but a test and a false breakdown did not happen. For this reason, it was not possible to get suitable market entry points. In the second half of the day, a false breakdown at 150.21 led to a signal to sell the dollar. As a result, the pair dropped by more than 40 pips.
Conditions for opening long positions on USD/JPY:
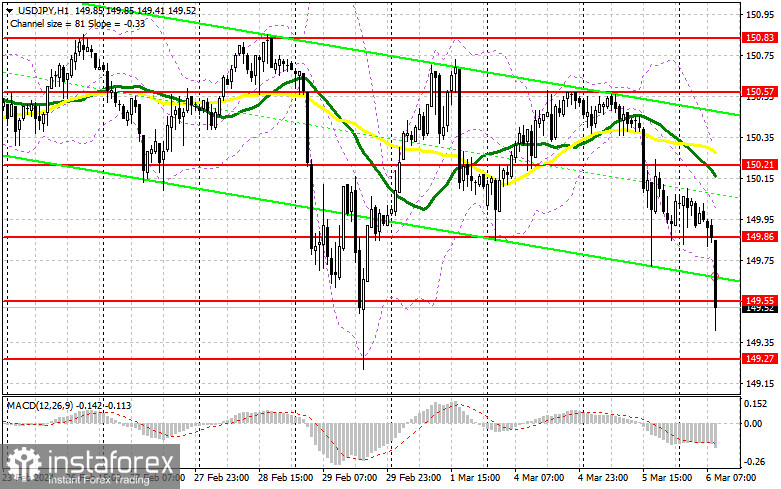
At the time of writing the article, there was a rather large drop in the dollar. The focus was shifted to the protection of the major level of 149.55. Only a false breakdown will create suitable conditions for increasing the number of long positions in the expectation of a breakout to 149.86. The breakout and a downward test will lead to another good option to buy the dollar, which can push USD/JPY up to the area of 150.21. The farthest target will be the area of 150.57, where I am going to lock in profits. A deeper decline in the pair and a lack of activity at 149.55 will lead to a new downward movement of the pair to the area of 149.27. It is likely that the yen growth is related to some actions of the Central Bank or statements of Japanese politicians. Only a false breakdown will give a signal to open long positions. I plan to buy USD/JPY just after a rebound from the low near 148.95, expecting a correction of 30-35 pips intraday.
Conditions for opening short positions on USD/JPY:
If the pair grows, bears will surely become active in the area of 149.86. A false breakdown there will create suitable conditions for opening short positions in the expectation of a deeper drop to the support at 149.55, for which there is an active struggle. A breakout and an upward test of this range will deal a more serious blow to bulls' positions, which will open the way to 149.27, which will definitely affect the pair's upside potential, increasing the chances of building a downtrend. The farthest target will be at 148.95, where I am going to take a profit. If USD/JPY grows and sellers fail to be active at 149.86, buyers will regain control over the market. However, it is too early to talk about the development of a stronger uptrend. In this case, it is best to postpone selling until the price tests the next resistance level of 150.21. If there is no downside movement, I will sell USD/JPY immediately after a bounce from 150.57, in anticipation of a 30-35-pip decline within the day.
COT report
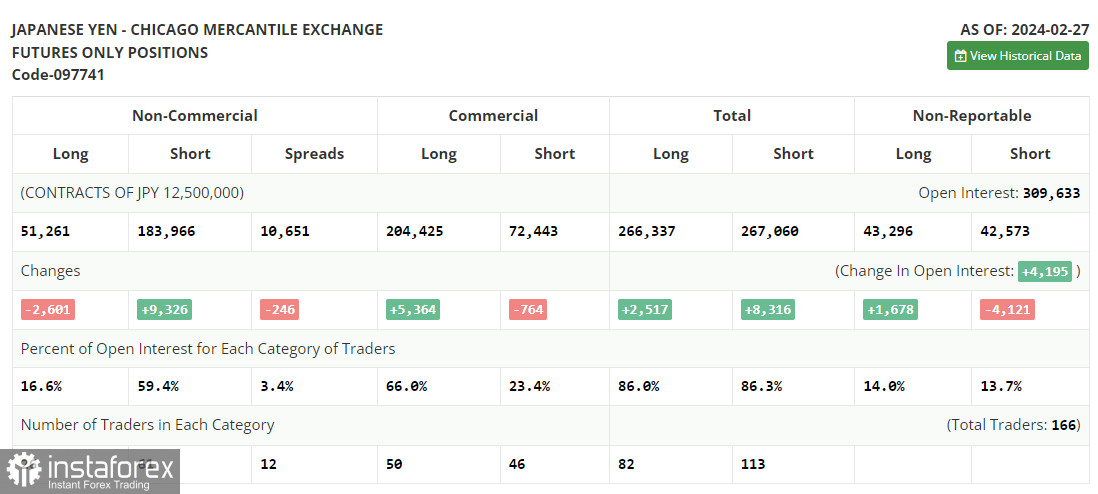
According to the COT report (Commitment of Traders) for February 27, the number of short positions increased, whereas the number of long positions dropped. The dollar's price of 150 yen remains a problem for traders. First of all, it is expensive, and somewhere at this level, the Central Bank of Japan starts to intervene. However, there are absolutely no reasons to sell. Recent statements by central bank officials that policy will be brought back to normal forced traders to buy the yen, thus causing a fall in USD/JPY. The latest COT report shows that long non-commercial positions declined by 2,601 to 51,261 while short non-commercial positions jumped by 9,326 to 183,966. As a result, the spread between long and short positions fell by 246.
Indicators' signals
Moving averages
The instrument is trading below the 30 and 50-day moving averages, which points to a deeper drop in the pair.
Note: The period and prices of the moving averages are considered by the analyst on the 1-hour chart and differ from the general definition of classic daily moving averages on the daily chart.
Bollinger Bands
If the pair declines, the lower limit, located at 149.65, will act as support.
Description of indicators
*The market analysis posted here is meant to increase your awareness, but not to give instructions to make a trade.
InstaSpot analytical reviews will make you fully aware of market trends! Being an InstaSpot client, you are provided with a large number of free services for efficient trading.


