


The legend in the InstaSpot team!
Legend! You think that's bombastic rhetoric? But how should we call a man, who became the first Asian to win the junior world chess championship at 18 and who became the first Indian Grandmaster at 19? That was the start of a hard path to the World Champion title for Viswanathan Anand, the man who became a part of history of chess forever. Now one more legend in the InstaSpot team!


Borussia is one of the most titled football clubs in Germany, which has repeatedly proved to fans: the spirit of competition and leadership will certainly lead to success. Trade in the same way that sports professionals play the game: confidently and actively. Keep a "pass" from Borussia FC and be in the lead with InstaSpot!

Trend analysis (Fig. 1)
On Tuesday, from the level of 1.1012 (closing of Friday's daily candle), EUR/USD will rise and test the historical resistance level of 1.1063 (blue dashed line). After that, the pair may start moving downwards.
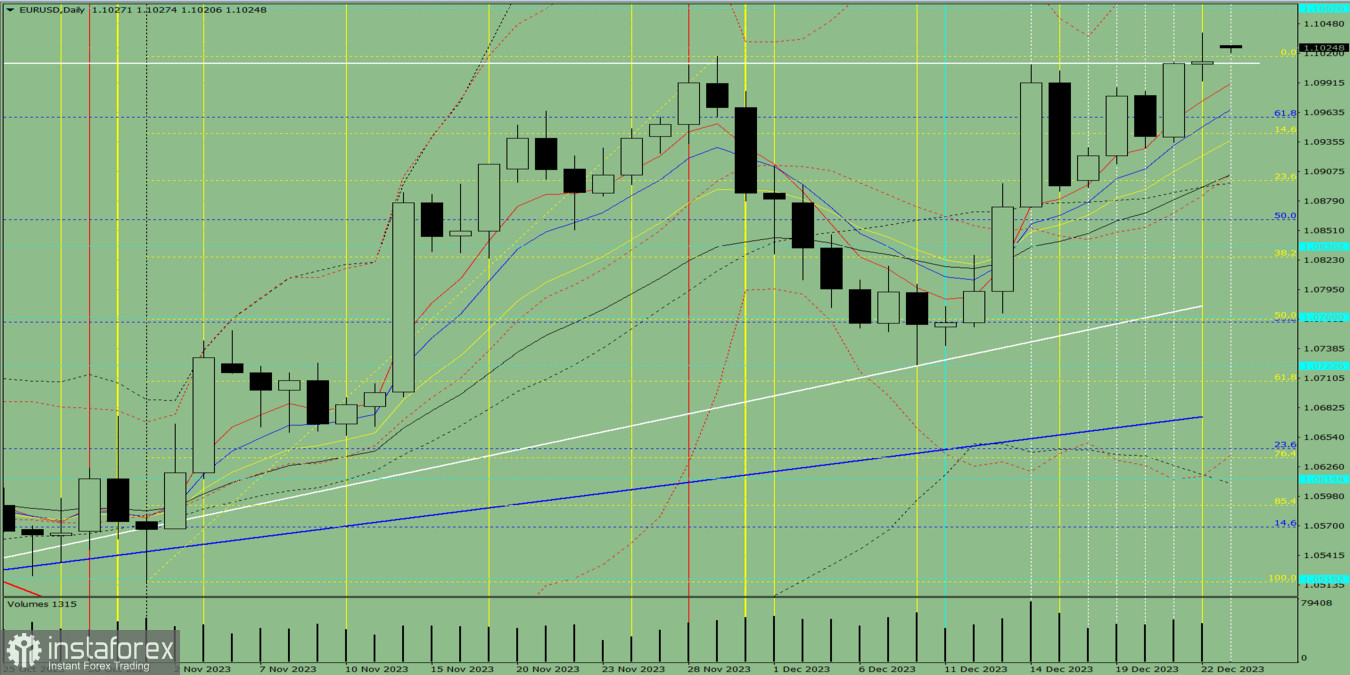
Fig. 1 (daily chart)
Comprehensive analysis:
Indicator analysis - uptrend
volume- uptrend
Candlestick analysis - uptrend
Trend analysis - uptrend
Bollinger bands - uptrend
Weekly chart - uptrend
Conclusion: Moving upwards from the level of 1.1012 (closing of Friday's daily candle), EUR/USD will test the historical resistance level of 1.1063 (blue dashed line), followed by the start of a price decline.
Alternatively, it could climb from the level of 1.1012 (closing of Friday's daily candle) to the historical resistance level of 1.1063 (blue dashed line), and then move further upward.
*The market analysis posted here is meant to increase your awareness, but not to give instructions to make a trade.
InstaSpot analytical reviews will make you fully aware of market trends! Being an InstaSpot client, you are provided with a large number of free services for efficient trading.


