


فريقنا لديه أكثر من 7,000,000 من التجار!
كل يوم نعمل معا لتحسين التداول. نحصل على نتائج عالية ونمضي قدما.
الاعتراف من قبل الملايين من التجار في جميع أنحاء العالم هو أفضل تقدير لعملنا! لقد قمت باختيارك وسنفعل كل ما يلزم لتلبية توقعاتك!
نحن فريق رائع معا!
إنستافوركس تعتز بالعمل بالنسبة لك!


الممثل وبطل مسابقة يو إف سي 6 وبطل حقيقي!
الرجل الذي حقق النجاح بعمله الدؤوب. الرجل الذي يذهب كما نريد.
سر نجاح تاكتاروف هو حركة مستمرة نحو الهدف.
اكشف عن جميع جوانب موهبتك!
اكتشف، وحاول، وافشل - ولكن لا تتوقف أبدا!
إنستافوركس. تبدأ قصة نجاحك من هنا!
Trend analysis (Fig. 1)
On Tuesday, from the level of 1.1012 (closing of Friday's daily candle), EUR/USD will rise and test the historical resistance level of 1.1063 (blue dashed line). After that, the pair may start moving downwards.
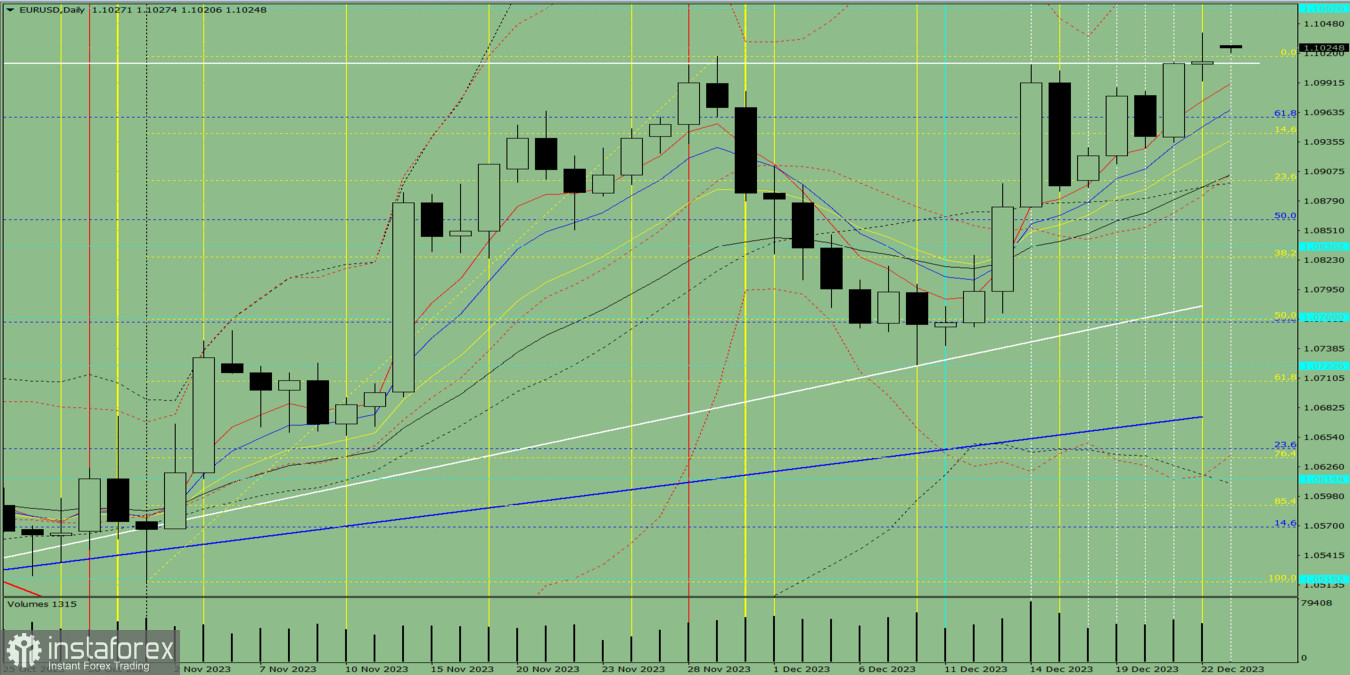
Fig. 1 (daily chart)
Comprehensive analysis:
Indicator analysis - uptrend
volume- uptrend
Candlestick analysis - uptrend
Trend analysis - uptrend
Bollinger bands - uptrend
Weekly chart - uptrend
Conclusion: Moving upwards from the level of 1.1012 (closing of Friday's daily candle), EUR/USD will test the historical resistance level of 1.1063 (blue dashed line), followed by the start of a price decline.
Alternatively, it could climb from the level of 1.1012 (closing of Friday's daily candle) to the historical resistance level of 1.1063 (blue dashed line), and then move further upward.
*The market analysis posted here is meant to increase your awareness, but not to give instructions to make a trade.
InstaSpot analytical reviews will make you fully aware of market trends! Being an InstaSpot client, you are provided with a large number of free services for efficient trading.


