


Our team has over 7,000,000 traders!
Every day we work together to improve trading. We get high results and move forward.
Recognition by millions of traders all over the world is the best appreciation of our work! You made your choice and we will do everything it takes to meet your expectations!
We are a great team together!
InstaSpot. Proud to work for you!


Actor, UFC 6 tournament champion and a true hero!
The man who made himself. The man that goes our way.
The secret behind Taktarov's success is constant movement towards the goal.
Reveal all the sides of your talent!
Discover, try, fail - but never stop!
InstaSpot. Your success story starts here!

Monday, as usual, was accompanied by an empty macroeconomic calendar. Important statistical data were not published in the European Union, the United Kingdom, and the United States.
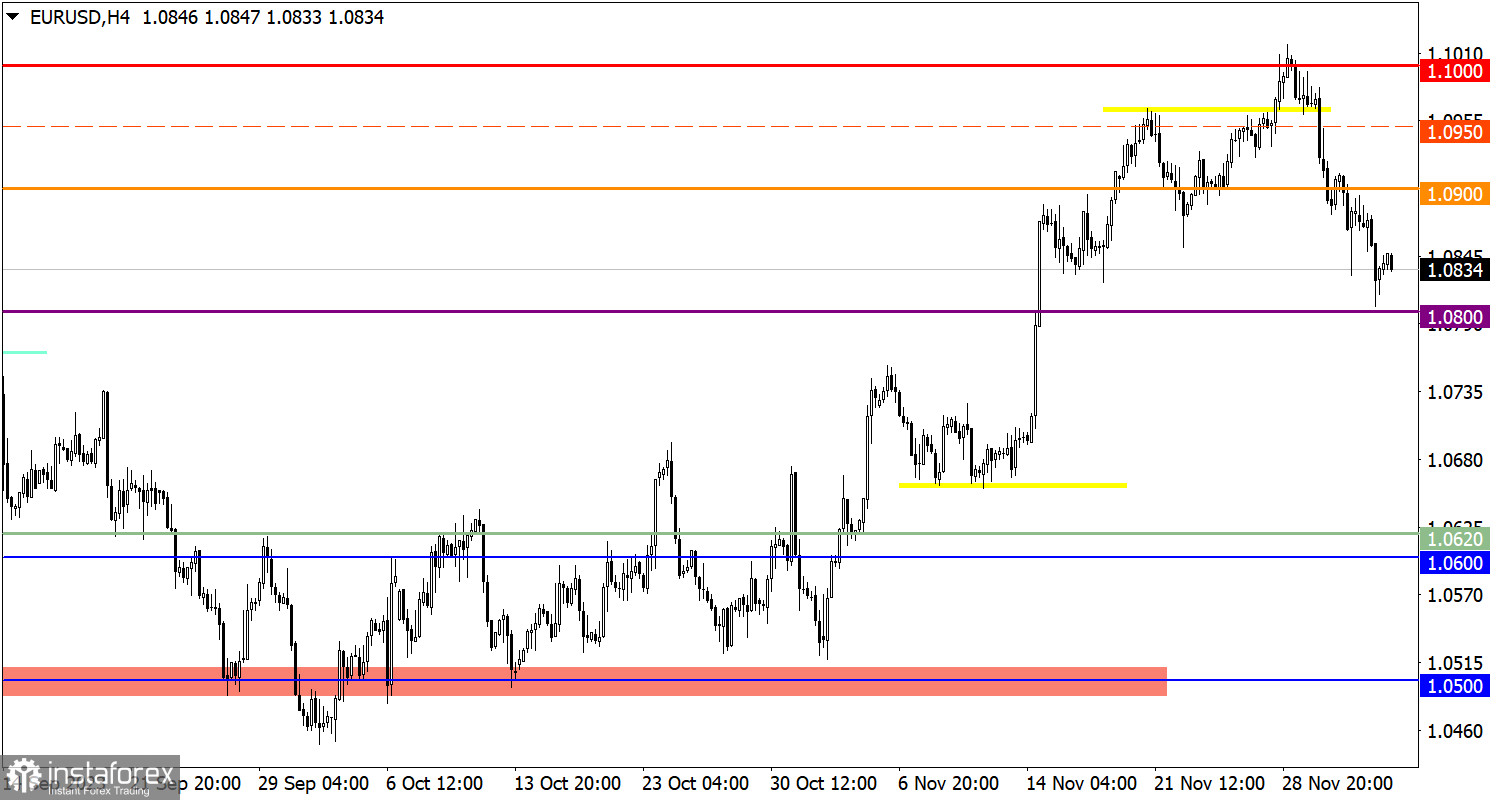
The EUR/USD currency pair increased the volume of short positions around the level of 1.0900. As a result, a new downturn emerged, based on which the quote updated the local low of the correction cycle.
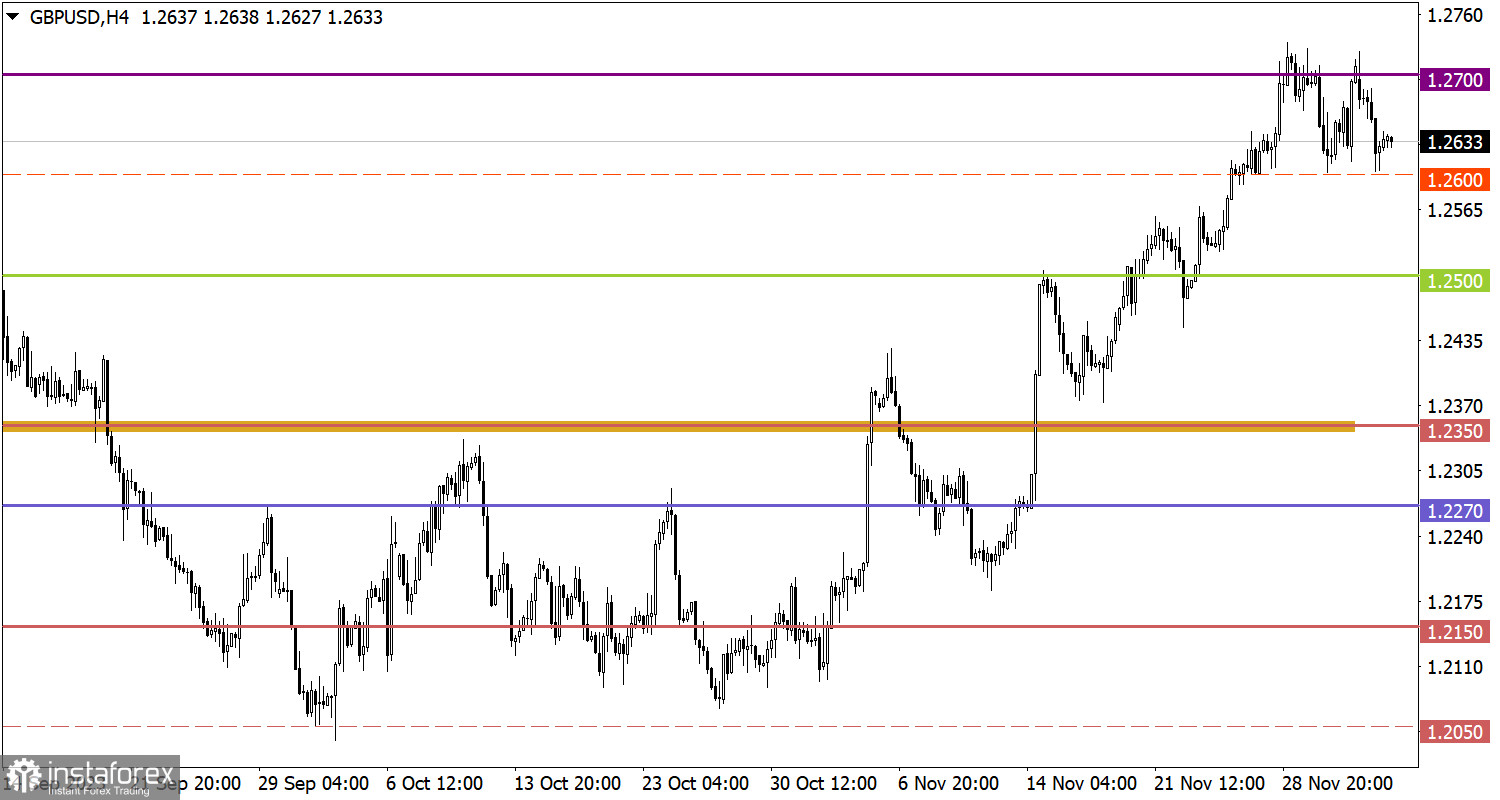
The GBP/USD pair once again bounced off the 1.2700 resistance level. As a result, there was an increase in the volume of short positions, which brought the quote back to the vicinity of 1.2600.

Today, the publication of the Producer Price Index in the EU is expected, which, according to analysts' expectations, may grow from -12.4% to -9.5%. Some growth in producer prices reduces the likelihood of a reduction in the European Central Bank refinancing rate already this month. Thus, the euro may strengthen slightly in value relative to the recent decline.
During the downward movement, the quote approached the support level of 1.0800, where the volume of short positions decreased, leading to a slowdown in the downward cycle. For the subsequent construction of a correction, price stabilization below the level of 1.0800 is necessary. Otherwise, there may be a phased process of the euro rate recovering from the recent decline.
Based on the cycle of weekly price fluctuations, a characteristic sideways amplitude of 1.2600/1.2700 can be observed, within which the quote moves. In this situation, the optimal tactic is considered to be the outgoing impulse method from the sideways range.
What's on the charts
The candlestick chart type is white and black graphic rectangles with lines above and below. With a detailed analysis of each individual candle, you can see its characteristics relative to a particular time frame: opening price, closing price, intraday high and low.
Horizontal levels are price coordinates, relative to which a price may stop or reverse its trajectory. In the market, these levels are called support and resistance.
Circles and rectangles are highlighted examples where the price reversed in history. This color highlighting indicates horizontal lines that may put pressure on the asset's price in the future.
The up/down arrows are landmarks of the possible price direction in the future.
*The market analysis posted here is meant to increase your awareness, but not to give instructions to make a trade.
InstaSpot analytical reviews will make you fully aware of market trends! Being an InstaSpot client, you are provided with a large number of free services for efficient trading.


