


我们的团队有超过700万的操盘手!
我们每天都在一起努力改善交易。我们得到了很高的成绩,并继续前进。
世界各地数以百万计的操盘手的认可是我们工作的最大赞赏! 您做出了您的选择,我们将尽一切努力来满足您的期望!
我们是一个共同的伟大团队!
InstaSpot. 自豪地为您工作!


Monday, as usual, was accompanied by an empty macroeconomic calendar. Important statistical data were not published in the European Union, the United Kingdom, and the United States.
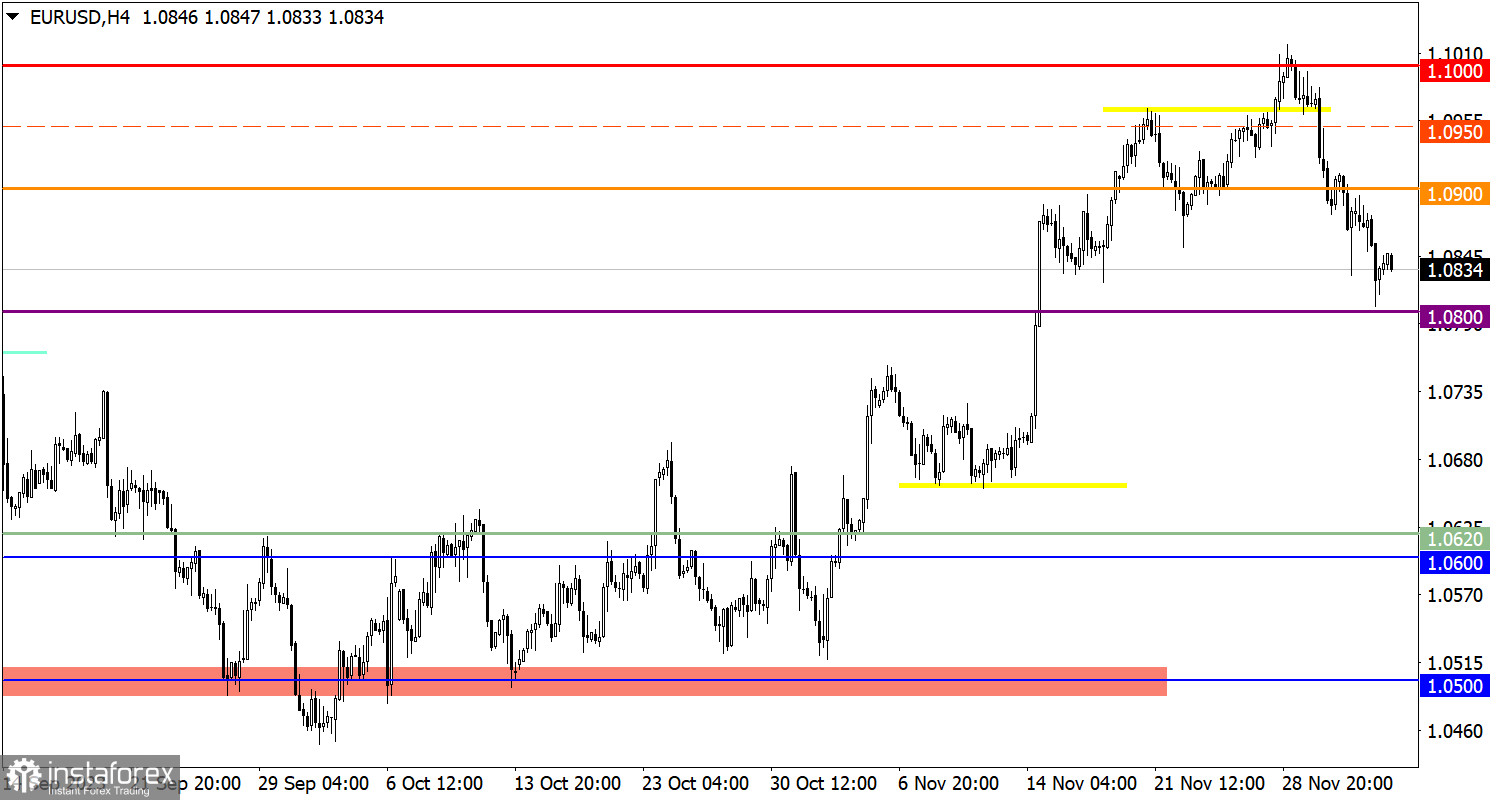
The EUR/USD currency pair increased the volume of short positions around the level of 1.0900. As a result, a new downturn emerged, based on which the quote updated the local low of the correction cycle.
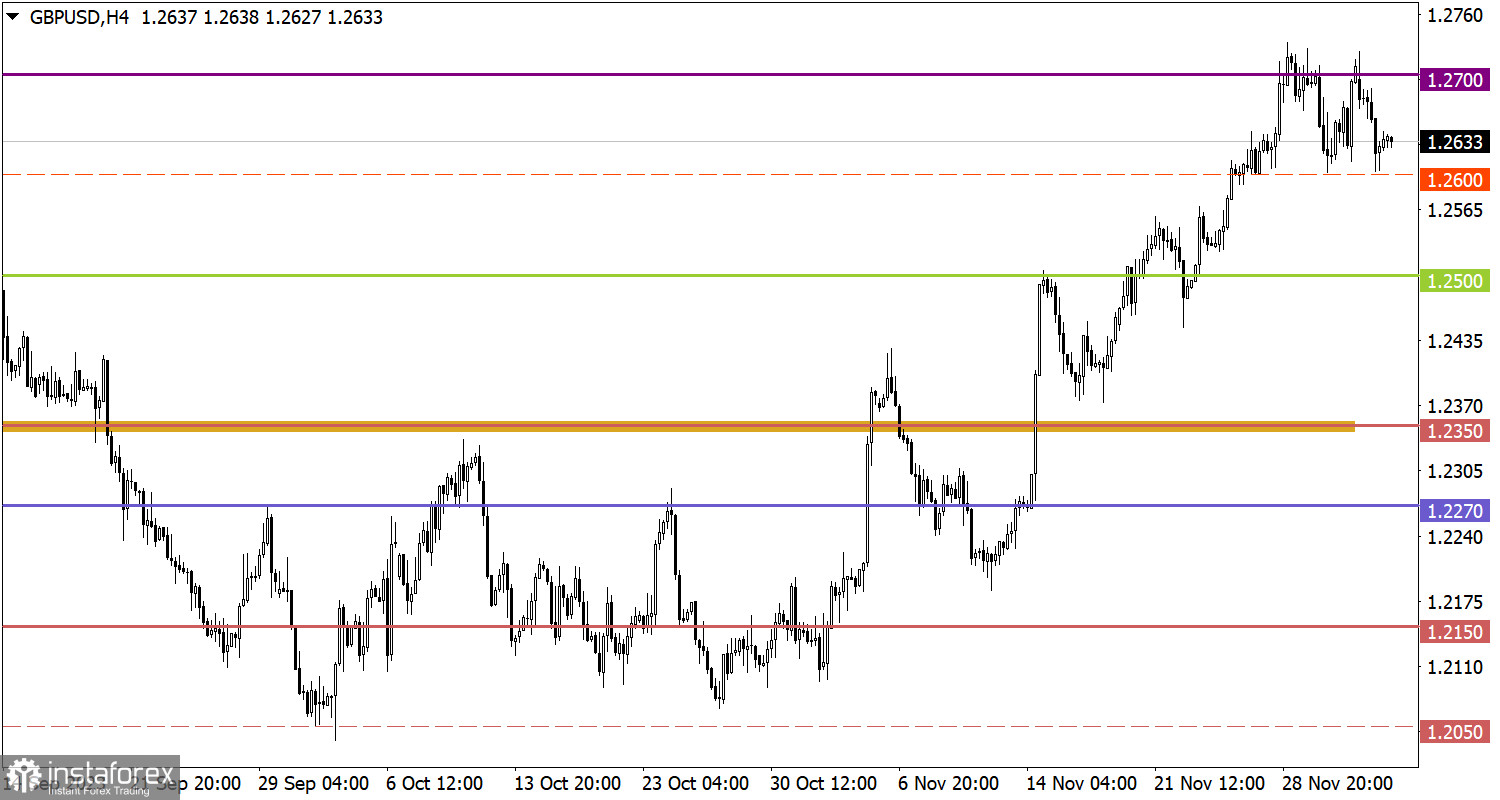
The GBP/USD pair once again bounced off the 1.2700 resistance level. As a result, there was an increase in the volume of short positions, which brought the quote back to the vicinity of 1.2600.

Today, the publication of the Producer Price Index in the EU is expected, which, according to analysts' expectations, may grow from -12.4% to -9.5%. Some growth in producer prices reduces the likelihood of a reduction in the European Central Bank refinancing rate already this month. Thus, the euro may strengthen slightly in value relative to the recent decline.
During the downward movement, the quote approached the support level of 1.0800, where the volume of short positions decreased, leading to a slowdown in the downward cycle. For the subsequent construction of a correction, price stabilization below the level of 1.0800 is necessary. Otherwise, there may be a phased process of the euro rate recovering from the recent decline.
Based on the cycle of weekly price fluctuations, a characteristic sideways amplitude of 1.2600/1.2700 can be observed, within which the quote moves. In this situation, the optimal tactic is considered to be the outgoing impulse method from the sideways range.
What's on the charts
The candlestick chart type is white and black graphic rectangles with lines above and below. With a detailed analysis of each individual candle, you can see its characteristics relative to a particular time frame: opening price, closing price, intraday high and low.
Horizontal levels are price coordinates, relative to which a price may stop or reverse its trajectory. In the market, these levels are called support and resistance.
Circles and rectangles are highlighted examples where the price reversed in history. This color highlighting indicates horizontal lines that may put pressure on the asset's price in the future.
The up/down arrows are landmarks of the possible price direction in the future.
*这里的市场分析是为了增加您对市场的了解,而不是给出交易的指示。
InstaSpot分析评论将让您充分了解市场趋势! 作为InstaSpot的客户,您将获得大量的免费服务以实现有效的交易。


