


Our team has over 7,000,000 traders!
Every day we work together to improve trading. We get high results and move forward.
Recognition by millions of traders all over the world is the best appreciation of our work! You made your choice and we will do everything it takes to meet your expectations!
We are a great team together!
InstaSpot. Proud to work for you!


Actor, UFC 6 tournament champion and a true hero!
The man who made himself. The man that goes our way.
The secret behind Taktarov's success is constant movement towards the goal.
Reveal all the sides of your talent!
Discover, try, fail - but never stop!
InstaSpot. Your success story starts here!

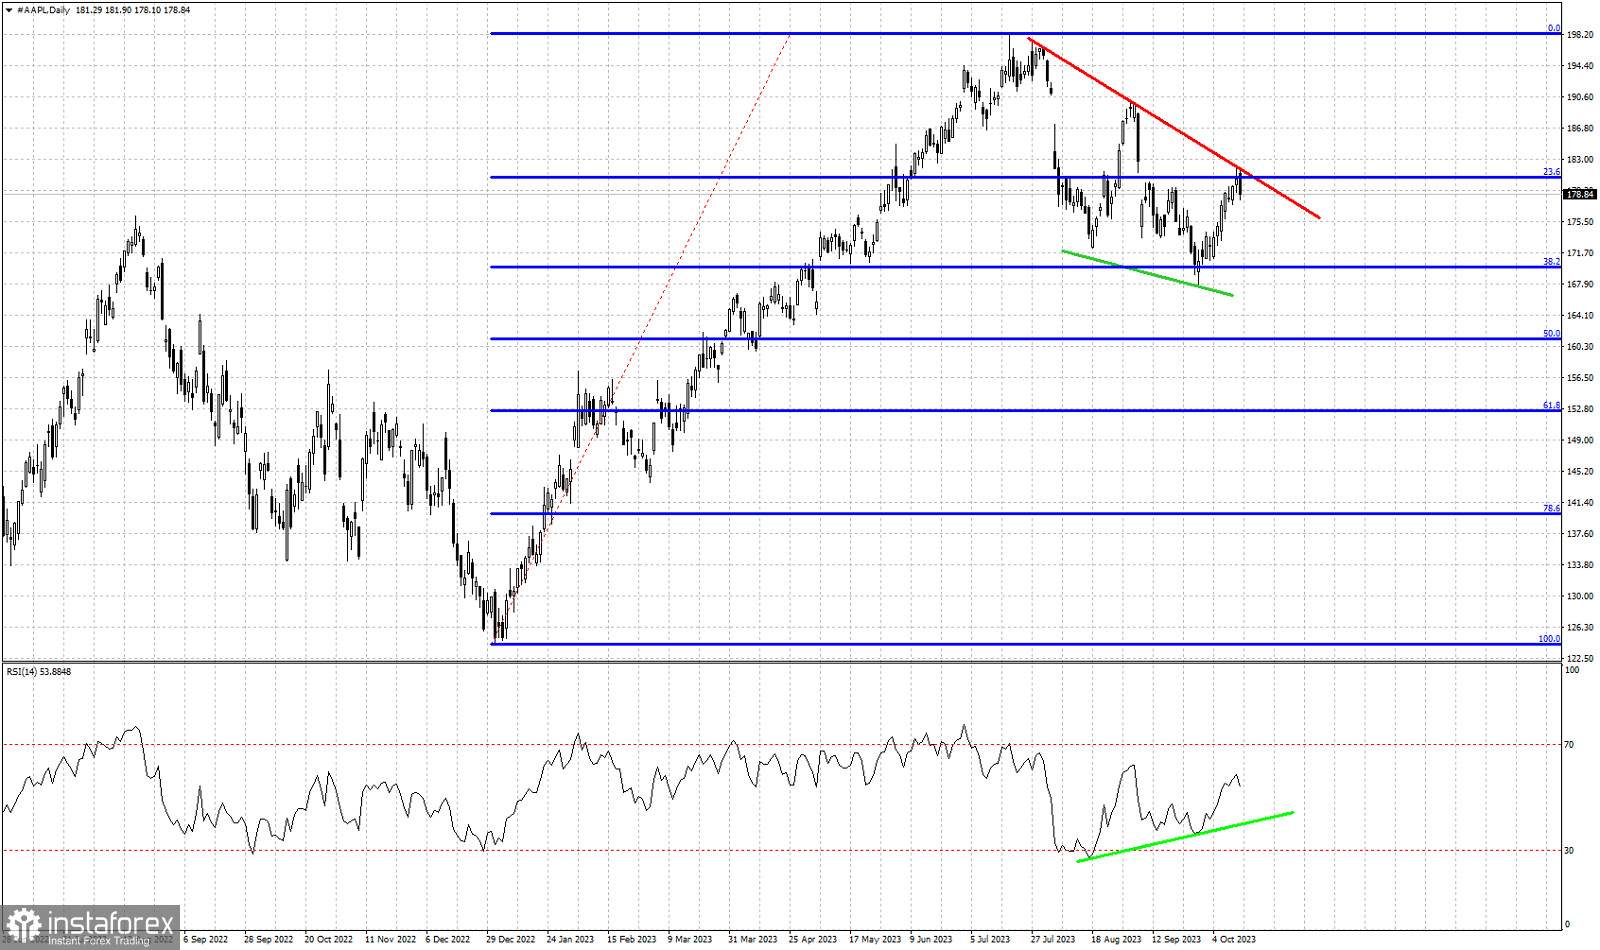
Blue lines- Fibonacci retracement levels
green lines- bullish divergence signal
Red line- resistance trend line
AAPL stock price is trading around $178.84. Price recently made a strong bounce despite making new lower lows at $169. Price has now reached the red downward sloping resistance trend line at $182. The lower low in price was not followed by a lower low in the RSI. The RSI provided a bullish divergence. This does not mean we could not see new lower lows. However it is an indication that the downward move is most probably corrective in nature. Recent price action has confirmed that resistance is important at $182 and as long as we trade below it, price will remain vulnerable to more downside. AAPL stock price has already retraced 38% of the entire upward move from December 2022 lows. A shallow retracement would be a bullish sign for the longer-term trend if bulls manage to start a new upward wave with higher highs and higher lows. For the time being we prefer to be neutral if not bearish as long as price is below the red trend line. There is potential for a new lower low towards the 50% Fibonacci retracement level.
*The market analysis posted here is meant to increase your awareness, but not to give instructions to make a trade.
InstaSpot analytical reviews will make you fully aware of market trends! Being an InstaSpot client, you are provided with a large number of free services for efficient trading.


