


Legenda dalam pasukan InstaSpot!
Legenda! Anda fikir ia adalah satu retorik yang besar? Tetapi bagaimana untuk kita memanggil seorang lelaki, yang telah menjadi pemain Asia pertama yang memenangi kejohanan catur dunia junior pada usia 18 tahun dan menjadi Grandmaster India pertama pada usia 19 tahun? Itulah permulaan yang sukar untuk merangkul gelaran Juara Dunia untuk Viswanathan Anand, seorang juara yang telah menjadi sebahagian daripada sejarah catur. Kini satu lagi legenda dalam pasukan InstaSpot!


Borussia adalah salah satu kelab bola sepak paling terkemuka di Jerman, yang telah berulang kali membuktikan kepada peminatnya: semangat persaingan dan kepemimpinan pasti akan membawa kepada kejayaan. Berdagang dengan cara yang sama seperti atlet sukan profesional beraksi menentang lawan: yakin dan aktif. Simpan "hantaran" dari Borussia FC dan menjadi pedagang hebat dengan InstaSpot!

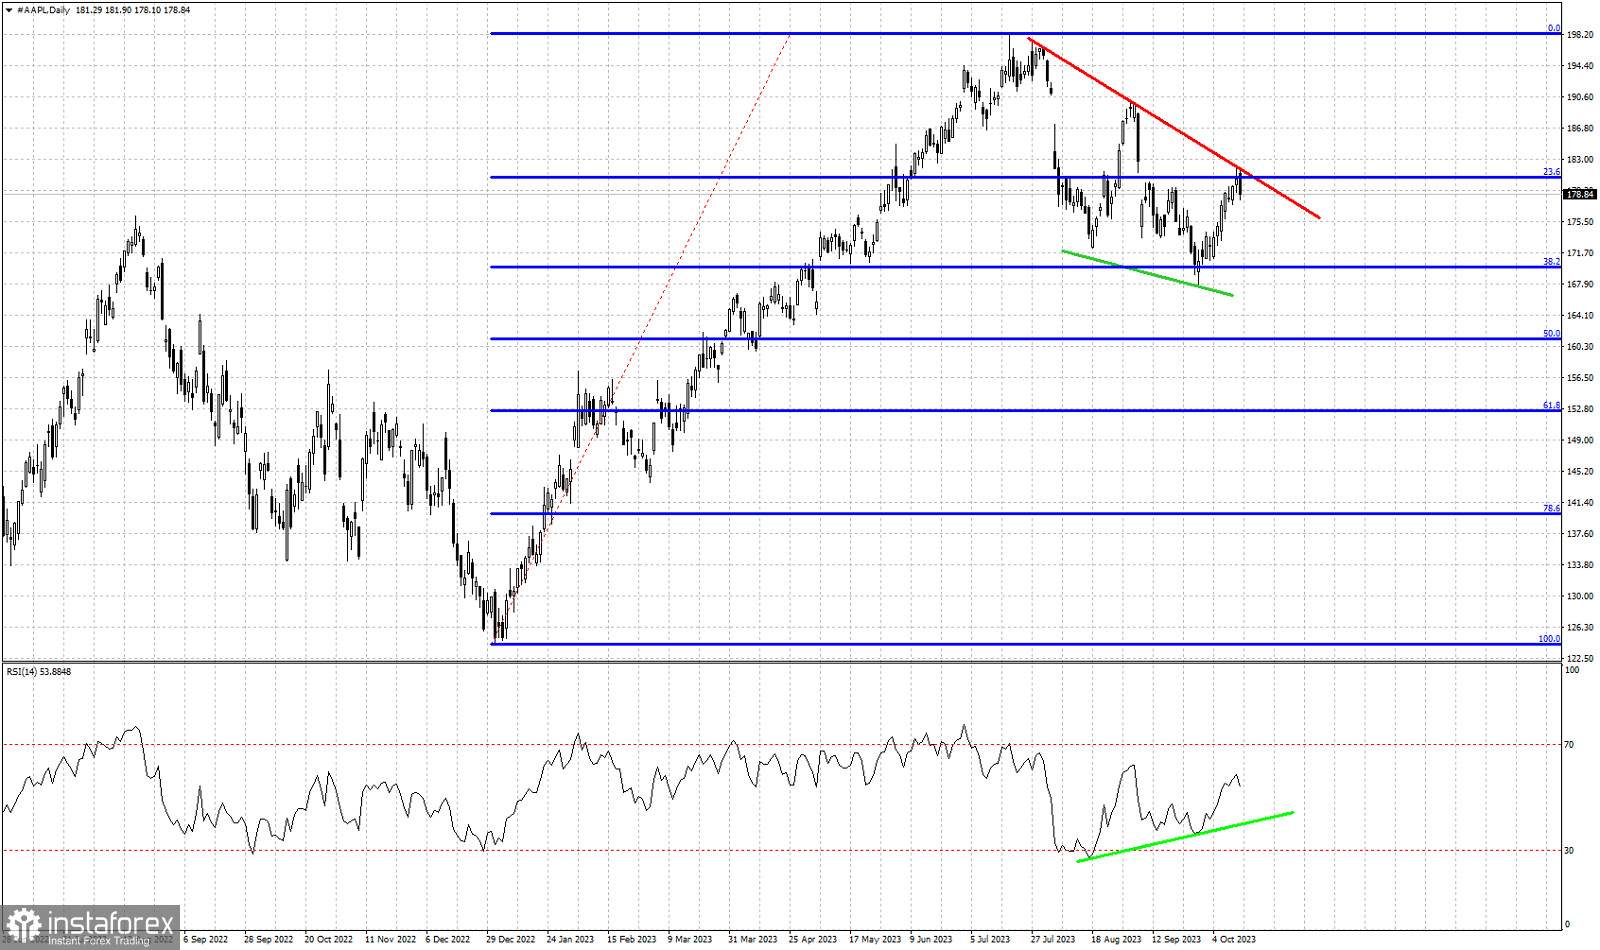
Blue lines- Fibonacci retracement levels
green lines- bullish divergence signal
Red line- resistance trend line
AAPL stock price is trading around $178.84. Price recently made a strong bounce despite making new lower lows at $169. Price has now reached the red downward sloping resistance trend line at $182. The lower low in price was not followed by a lower low in the RSI. The RSI provided a bullish divergence. This does not mean we could not see new lower lows. However it is an indication that the downward move is most probably corrective in nature. Recent price action has confirmed that resistance is important at $182 and as long as we trade below it, price will remain vulnerable to more downside. AAPL stock price has already retraced 38% of the entire upward move from December 2022 lows. A shallow retracement would be a bullish sign for the longer-term trend if bulls manage to start a new upward wave with higher highs and higher lows. For the time being we prefer to be neutral if not bearish as long as price is below the red trend line. There is potential for a new lower low towards the 50% Fibonacci retracement level.
* Analisis pasaran yang disiarkan di sini adalah bertujuan untuk meningkatkan kesedaran anda, tetapi tidak untuk memberi arahan untuk membuat perdagangan.
Kajian analisis InstaSpot akan membuat anda mengetahui sepenuhnya aliran pasaran! Sebagai pelanggan InstaSpot, anda disediakan sejumlah besar perkhidmatan percuma untuk dagangan yang cekap.


