


Our team has over 7,000,000 traders!
Every day we work together to improve trading. We get high results and move forward.
Recognition by millions of traders all over the world is the best appreciation of our work! You made your choice and we will do everything it takes to meet your expectations!
We are a great team together!
InstaSpot. Proud to work for you!


Actor, UFC 6 tournament champion and a true hero!
The man who made himself. The man that goes our way.
The secret behind Taktarov's success is constant movement towards the goal.
Reveal all the sides of your talent!
Discover, try, fail - but never stop!
InstaSpot. Your success story starts here!

The energy support plan developed by UK's Prime Minister Liz Truss and chancellor Kwasi Kwarteng has met strong resistance. Initially, it was disapproved by British banks. Yesterday, the Bank of England also manifested its discontent with such measures. What is more, the International Monetary Fund supposes that the implementation of the plan may spur a global financial crisis as it was in 2008. Even the House of Commons, where most places belong to the Conservative party led by Liz Truss, has severely criticized the plan and demanded to revise it drastically. This news has reassured investors that the plan will not be implemented in its initial variant. As a result, the pound/dollar pair showed a rebound. Now, everything will depend on the reaction of the UK cabinet of ministers. If Liz Truss' cabinet insists on the implementation of the existing plan, the situation may balloon into another political crisis. This, in turn, will have a negative effect on the pound sterling. If Liz Truss and Kwasi Kwarteng agree to revise their plan, the currency may continue the upward correction.
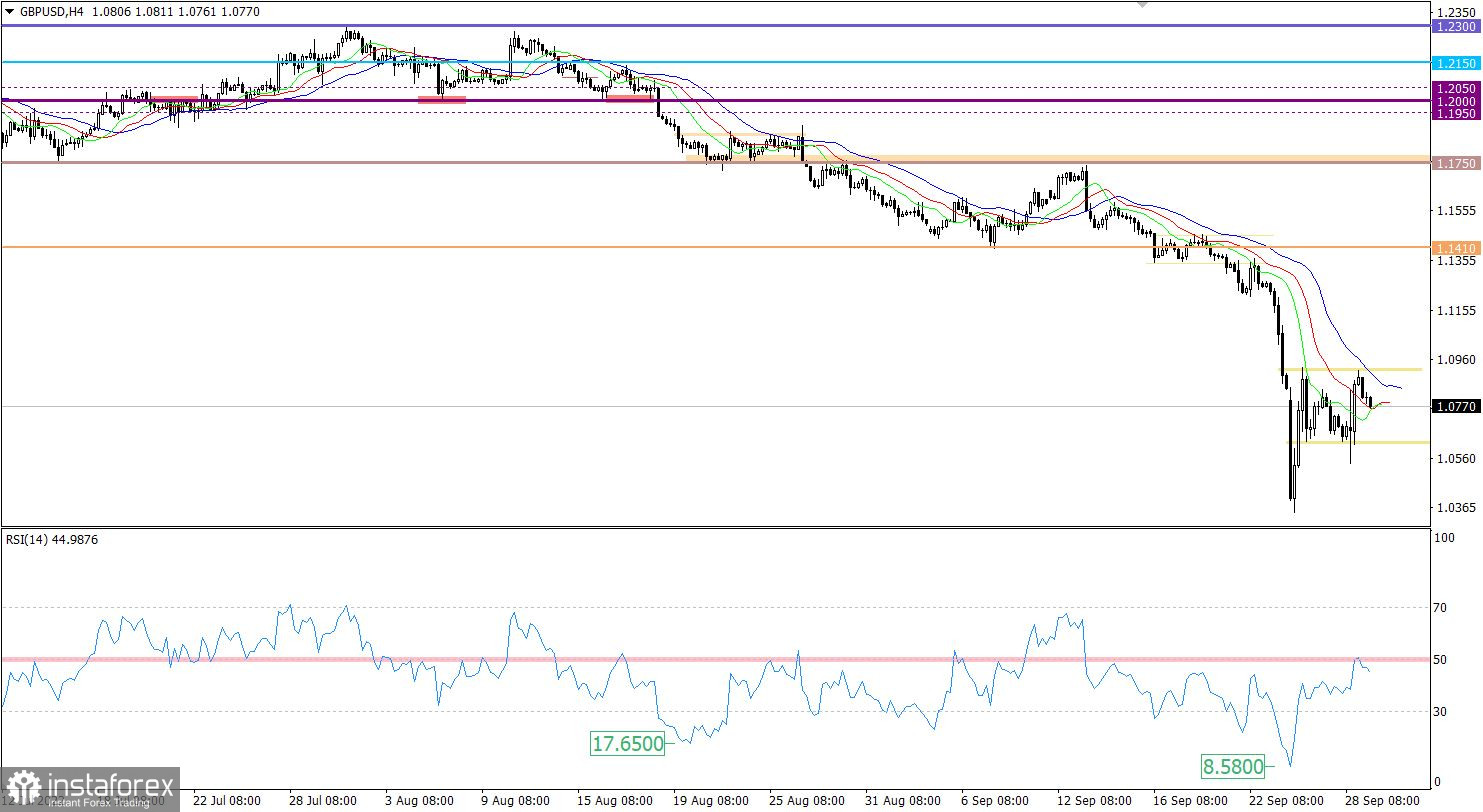
Meanwhile, the pound sterling continued moving amid market speculation. At the beginning of the previous trading day, there was a downward impulse that pushed the price below 1.0600. After that, an upward impulse allowed the pair to jump to the high recorded on Monday.
On the four-hour chart, the RSI technical indicator is hovering in the lower area of 30/50, which points to the bearish sentiment among traders. On the daily chart, the indicator is in the oversold area, which corresponds to the price settlement at the all-time lows.
On the four-hour chart, the Alligator's MAs have an initial intersection, which appeared amid the upward impulse. This technical signal does not point to a change in the market sentiment due to high speculative activity. On the daily chart, the indicator is reflecting the global downtrend. There are no intersections between MAs.
Outlook
Under the current conditions, the pair formed an untypically wide range of 1.0630/1.0930. Such a situation could be explained by high speculative interest among traders. It is quite possible that the pair will continue trading sideways until a particular trend forms.
In terms of the complex indicator analysis, we see that in the short-term and intraday periods, the indicator is providing sell signals amid a rebound from the upper limit of the range. In the mid-term period, the indicators are pointing to a downtrend.
*The market analysis posted here is meant to increase your awareness, but not to give instructions to make a trade.
InstaSpot analytical reviews will make you fully aware of market trends! Being an InstaSpot client, you are provided with a large number of free services for efficient trading.


