


Our team has over 7,000,000 traders!
Every day we work together to improve trading. We get high results and move forward.
Recognition by millions of traders all over the world is the best appreciation of our work! You made your choice and we will do everything it takes to meet your expectations!
We are a great team together!
InstaSpot. Proud to work for you!


Actor, UFC 6 tournament champion and a true hero!
The man who made himself. The man that goes our way.
The secret behind Taktarov's success is constant movement towards the goal.
Reveal all the sides of your talent!
Discover, try, fail - but never stop!
InstaSpot. Your success story starts here!

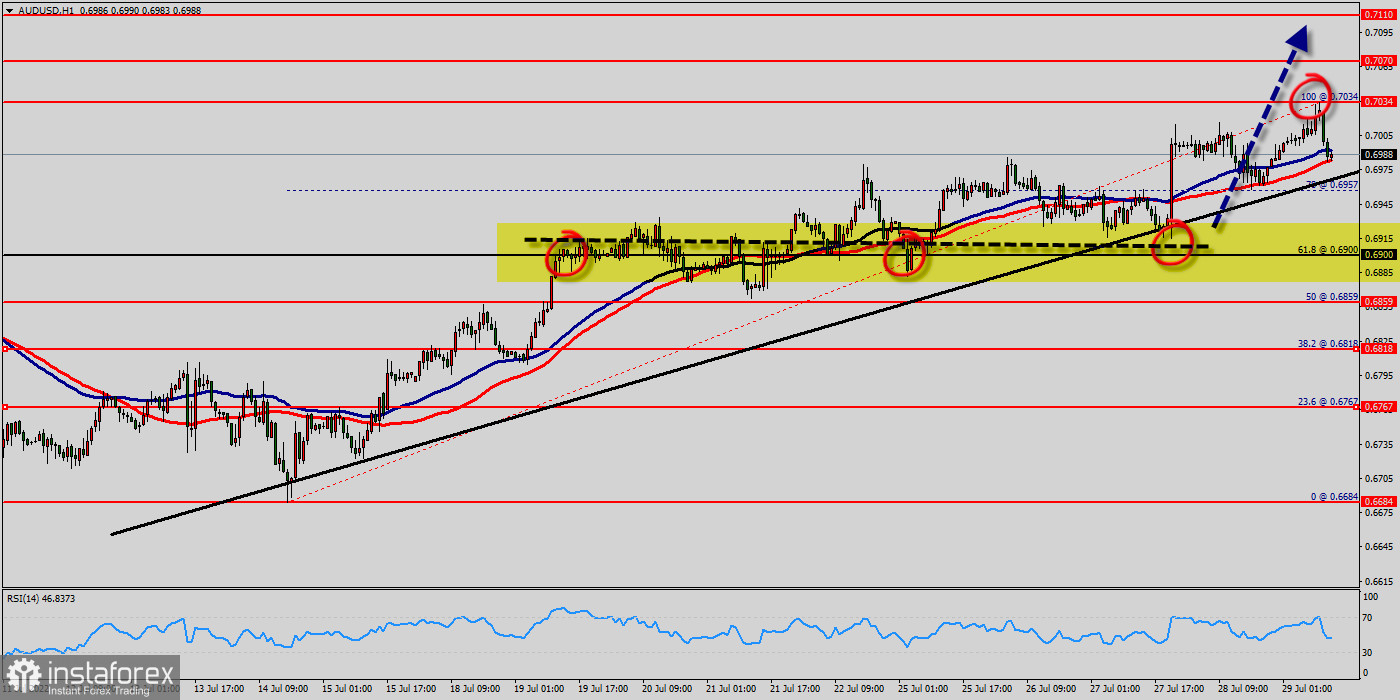
The AUD/USD pair continued moving upwards from the level of 0.6900. This week, the pair rose from the level of 0.6900 (weekly support) to the top around 0.7034. Today, the first support level is seen at 0.6900 followed by 0.6859, while daily resistance is seen at 0.7034.
Technical indicators (Moving average 50 and 100, RSI (14), trend, Fibonacci retracement levels) confirm the bullish opinion of this analysis in the very short term. However, be careful of excessive bullish movements.
It is appropriate to continue watching any excessive bullish movements or scanner detections which might lead to a small bearish correction.
The AUD/USD pair traded higher and closed the day in positive territory near the price of 0.6990. Today it was trading in a narrow range of 0.6990 - 0.7034, staying close to yesterday's closing price.
On the hourly chart, the AUD/USD pair broke through and fixed above the moving average line MA (100) H1 (0.6990). The situation is similar on the four-hour chart.
Based on the foregoing, it is probably worth sticking to the north direction in trading, and while the AUD/USD pair remains above MA 100 H1, it may be necessary to look for entry points to buy for the formation of a correction.
According to the previous events, the AUD/USD pair is still moving between the levels of 0.6900 and 0.7070; for that we expect a range of 170 pips in coming hours.
This would suggest a bullish market because the RSI indicator is still in a positive area and does not show any trend-reversal signs.
Furthermore, if the trend is able to break out through the first resistance level of 0.7034, we should see the pair climbing towards the new double top (0.7070) to test it.
On the contrary, if a breakout takes place at the support level of 0.6900, then this scenario may become invalidated. Remember to place a stop loss; it should be set below the second support of 0.6859.
*The market analysis posted here is meant to increase your awareness, but not to give instructions to make a trade.
InstaSpot analytical reviews will make you fully aware of market trends! Being an InstaSpot client, you are provided with a large number of free services for efficient trading.


