


Đội ngũ của chúng tôi có hơn 7,000,000 thương nhân!
Hàng ngày chúng tôi làm việc cùng nhau để cải thiện việc giao dịch. Chúng tôi nhận được kết quả cao và luôn tiến lên phía trước.
Sự công nhận của hàng triệu thương nhân trên toàn thế giới là sự đánh giá tốt nhất cho công việc của chúng tôi! Bạn đã đưa ra quyết định của mình và chúng tôi sẽ làm mọi thứ cần thiết để đáp ứng mong đợi của bạn!
Chúng ta cùng với nhau sẽ là một nhóm tuyệt vời!
InstaSpot. Tự hào làm việc cho bạn!


Diễn viên, nhà vô địch mùa giải UFC 6 và là người hùng thật sự!
Người tự mình làm nên tất cả. Người đàn ông đáng kể học hỏi.
Bí mật đằng sau thành công của Taktarov là sự cố gắng liên tục hướng tới mục tiêu.
Hãy khai phá tất cả các mặt tài năng của bạn!
Khám phá, thử, thất bại - nhưng không bao giờ dừng lại!
InstaSpot. Câu chuyện thành công của bạn bắt đầu từ đây!
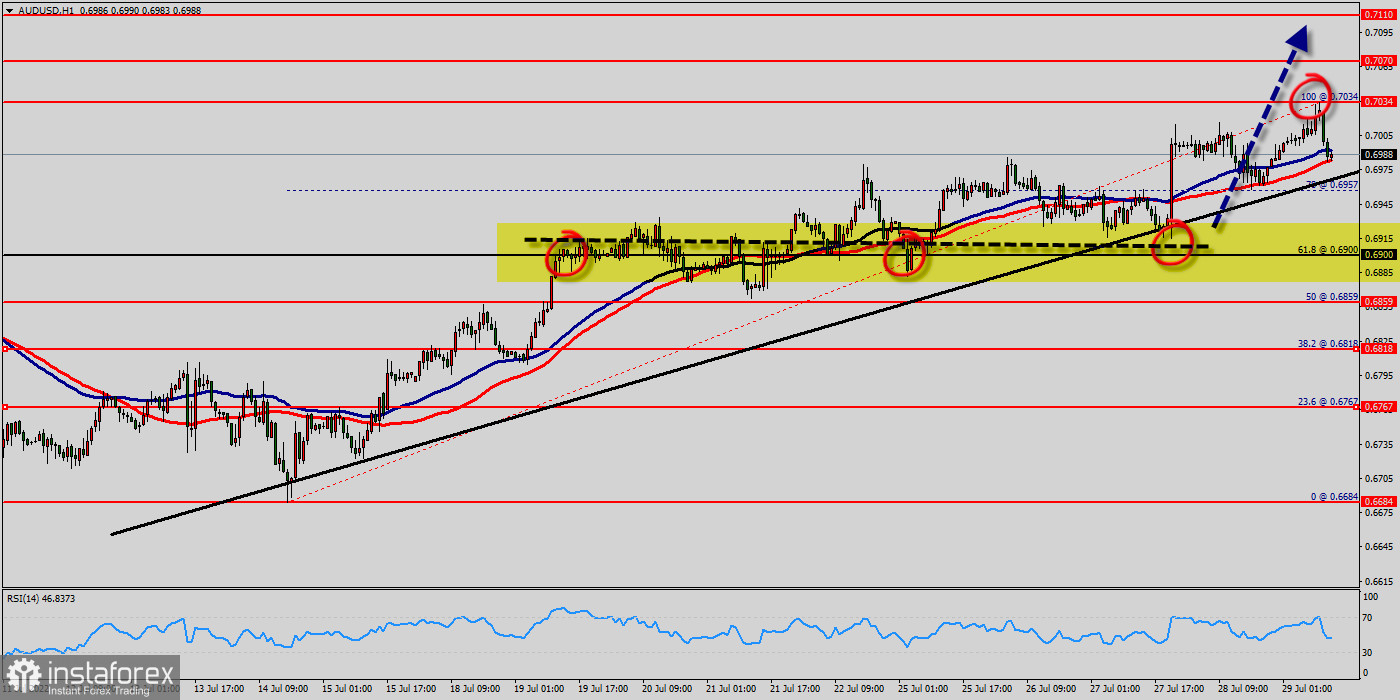
The AUD/USD pair continued moving upwards from the level of 0.6900. This week, the pair rose from the level of 0.6900 (weekly support) to the top around 0.7034. Today, the first support level is seen at 0.6900 followed by 0.6859, while daily resistance is seen at 0.7034.
Technical indicators (Moving average 50 and 100, RSI (14), trend, Fibonacci retracement levels) confirm the bullish opinion of this analysis in the very short term. However, be careful of excessive bullish movements.
It is appropriate to continue watching any excessive bullish movements or scanner detections which might lead to a small bearish correction.
The AUD/USD pair traded higher and closed the day in positive territory near the price of 0.6990. Today it was trading in a narrow range of 0.6990 - 0.7034, staying close to yesterday's closing price.
On the hourly chart, the AUD/USD pair broke through and fixed above the moving average line MA (100) H1 (0.6990). The situation is similar on the four-hour chart.
Based on the foregoing, it is probably worth sticking to the north direction in trading, and while the AUD/USD pair remains above MA 100 H1, it may be necessary to look for entry points to buy for the formation of a correction.
According to the previous events, the AUD/USD pair is still moving between the levels of 0.6900 and 0.7070; for that we expect a range of 170 pips in coming hours.
This would suggest a bullish market because the RSI indicator is still in a positive area and does not show any trend-reversal signs.
Furthermore, if the trend is able to break out through the first resistance level of 0.7034, we should see the pair climbing towards the new double top (0.7070) to test it.
On the contrary, if a breakout takes place at the support level of 0.6900, then this scenario may become invalidated. Remember to place a stop loss; it should be set below the second support of 0.6859.
*Phân tích thị trường được đăng tải ở đây có nghĩa là để gia tăng nhận thức của bạn, nhưng không đưa ra các chỉ dẫn để thực hiện một giao dịch.
InstaSpot analytical reviews will make you fully aware of market trends! Being an InstaSpot client, you are provided with a large number of free services for efficient trading.


