


Our team has over 7,000,000 traders!
Every day we work together to improve trading. We get high results and move forward.
Recognition by millions of traders all over the world is the best appreciation of our work! You made your choice and we will do everything it takes to meet your expectations!
We are a great team together!
InstaSpot. Proud to work for you!


Actor, UFC 6 tournament champion and a true hero!
The man who made himself. The man that goes our way.
The secret behind Taktarov's success is constant movement towards the goal.
Reveal all the sides of your talent!
Discover, try, fail - but never stop!
InstaSpot. Your success story starts here!

4h

The formation of the bull pattern on July 12 would allow traders to anticipate a trend beneficial for the European currency. The growth will continue through the direction of the correction level of 200.0% - 130.91. Such formation will be recognized as a trend based on the direction of the equidistant channel. Setting the rate above the Fibo level of 200.0% will increase chances of consistent growth towards the next correction level of 261.8% - 135.91.
The Fibonacci grid is established on the upper limits of March 13, 2017 and April 17, 2017.
Daily
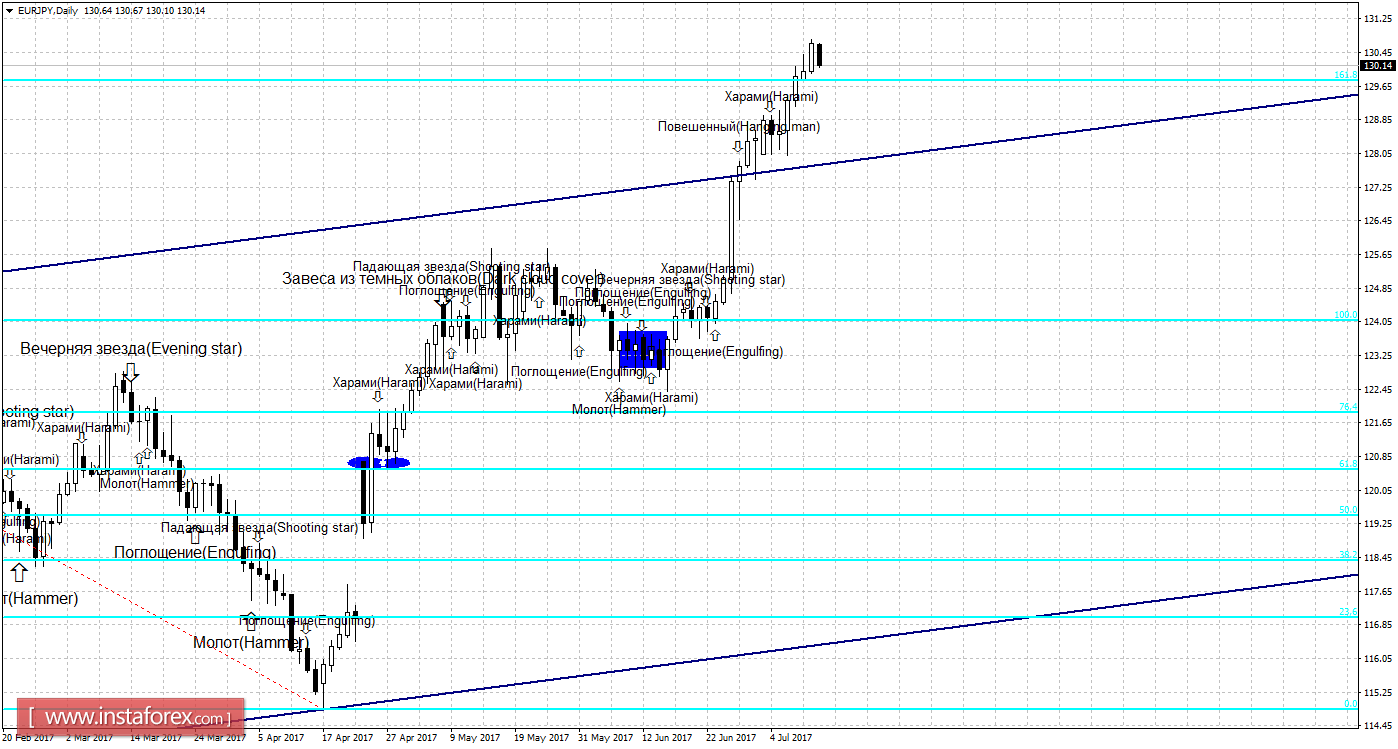
In the 24-hour chart, the prices were fixed above the correction level of 161.8% - 129.78, which eventually allows to resume the growth towards the next Fibo level of 200.0% - 133.33.
The Fibonacci grid is placed on the extremes from December 15, 2016 and April 17, 2017.
Specification:
Weak candle formations will be marked by plain text with a smaller size of the arrows.
Strong candle formations will be marked by bold text with a larger size of arrows.
*The market analysis posted here is meant to increase your awareness, but not to give instructions to make a trade.
InstaSpot analytical reviews will make you fully aware of market trends! Being an InstaSpot client, you are provided with a large number of free services for efficient trading.


