


我们的团队有超过700万的操盘手!
我们每天都在一起努力改善交易。我们得到了很高的成绩,并继续前进。
世界各地数以百万计的操盘手的认可是我们工作的最大赞赏! 您做出了您的选择,我们将尽一切努力来满足您的期望!
我们是一个共同的伟大团队!
InstaSpot. 自豪地为您工作!


4h

The formation of the bull pattern on July 12 would allow traders to anticipate a trend beneficial for the European currency. The growth will continue through the direction of the correction level of 200.0% - 130.91. Such formation will be recognized as a trend based on the direction of the equidistant channel. Setting the rate above the Fibo level of 200.0% will increase chances of consistent growth towards the next correction level of 261.8% - 135.91.
The Fibonacci grid is established on the upper limits of March 13, 2017 and April 17, 2017.
Daily
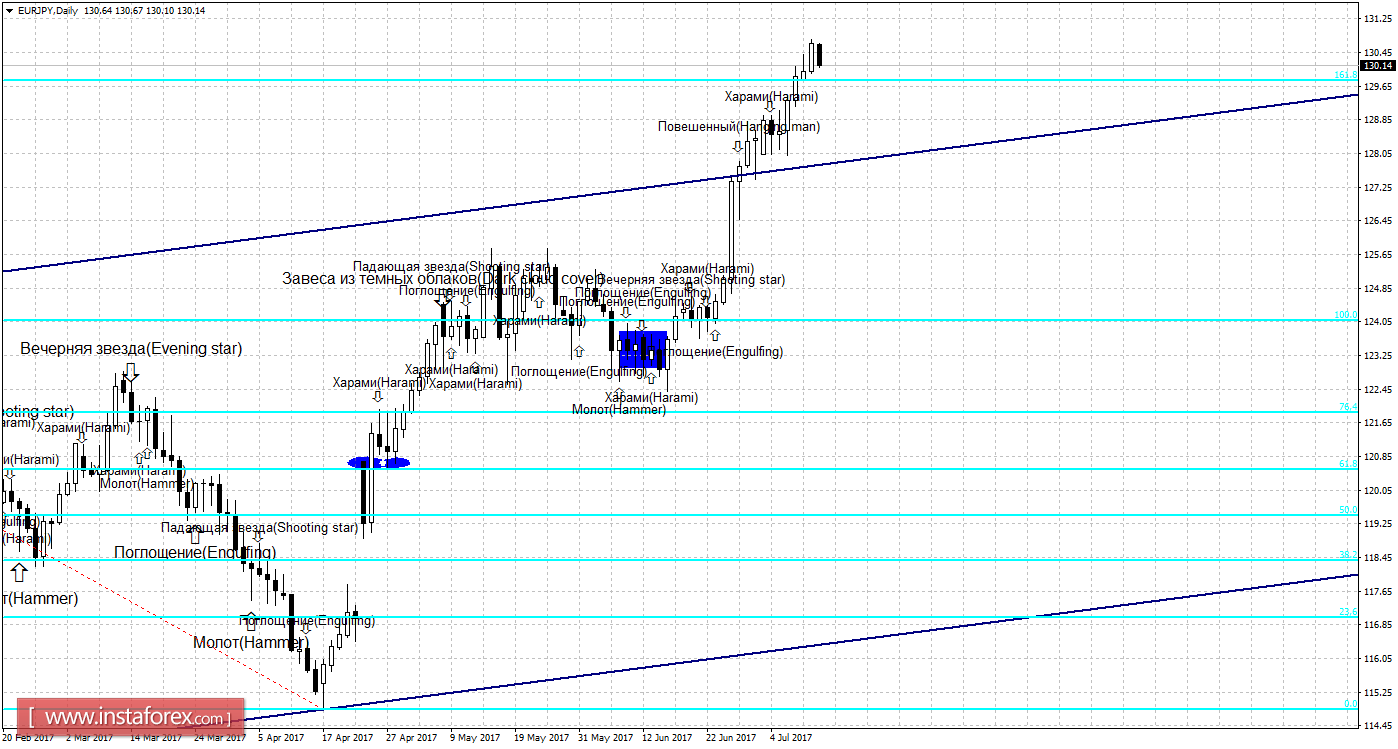
In the 24-hour chart, the prices were fixed above the correction level of 161.8% - 129.78, which eventually allows to resume the growth towards the next Fibo level of 200.0% - 133.33.
The Fibonacci grid is placed on the extremes from December 15, 2016 and April 17, 2017.
Specification:
Weak candle formations will be marked by plain text with a smaller size of the arrows.
Strong candle formations will be marked by bold text with a larger size of arrows.
*这里的市场分析是为了增加您对市场的了解,而不是给出交易的指示。
InstaSpot分析评论将让您充分了解市场趋势! 作为InstaSpot的客户,您将获得大量的免费服务以实现有效的交易。


