


The legend in the InstaSpot team!
Legend! You think that's bombastic rhetoric? But how should we call a man, who became the first Asian to win the junior world chess championship at 18 and who became the first Indian Grandmaster at 19? That was the start of a hard path to the World Champion title for Viswanathan Anand, the man who became a part of history of chess forever. Now one more legend in the InstaSpot team!


Borussia is one of the most titled football clubs in Germany, which has repeatedly proved to fans: the spirit of competition and leadership will certainly lead to success. Trade in the same way that sports professionals play the game: confidently and actively. Keep a "pass" from Borussia FC and be in the lead with InstaSpot!

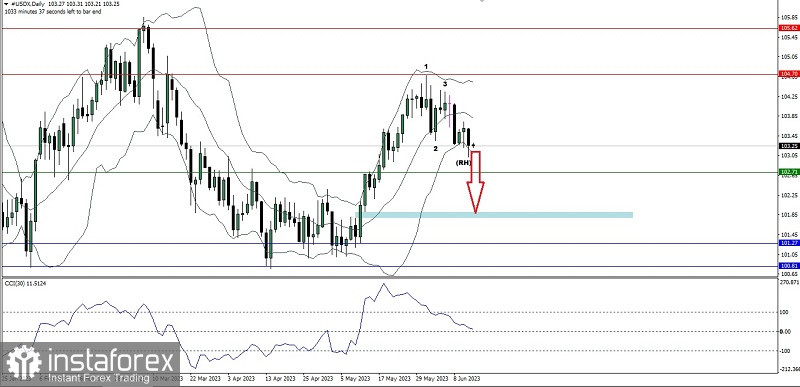
On the daily chart of the United States Dollar Index, you can see the appearance of a Bearish 123 pattern followed by a Bearish Ross Hook (RH) where currently USDX is trying to break below the 103.02 level. If it is successfully broken, then USDX will find a significant support level at 102.71 which has been confirmed. by CCI (30) which is heading to level 0, but if it is successfully broken it is not impossible for USDX to continue its depreciation to the level of the Bullish Fair Value Gap area at the level of the 101.91-101.78 area with a note that during the way down there was no upward correction that exceeded the level 104.10 because if this level is broken above then all the downward scenarios previously described will become invalid and cancel automatically.
(Disclaimer)
*The market analysis posted here is meant to increase your awareness, but not to give instructions to make a trade.
InstaSpot analytical reviews will make you fully aware of market trends! Being an InstaSpot client, you are provided with a large number of free services for efficient trading.


