


ทีมงานของพวกเรา พร้อมกับเทรดเดอร์มากกว่า 7,000,000 คน!
ในทุกวัน พวกเราได้รวมงานร่วมกันเพื่อพัฒนาการเทรด พวกเรามีผลตอบรับที่ดี และยังเดินหน้าต่อไป
การยอมรับจากเทรดเดอร์นับล้านจากทั่วทุกมุมโลกนั้นเป็น ผลงา่นอันน่าประทับใจมากที่สุดของพวกเรา! คุณเลือกตัวเลือก และพวกเราจะจัดการทุกอย่างให้ตรงกับการคาดหวังของคุณ !
พวกเราเป็นทีมงานที่ดีที่สุด!
InstaSpot รู้สึกเป็นเกียรติที่ได้ร่วมงานกับคุณ !


นักแสดง, แชมป์เปี้ยนทัวร์นาเม้น UFC 6 และฮิโรที่แท้จริง !
ชายผู้สามารถก่อร่างสร้างตัวขึ้นมาได้ด้วยตัวเขาเอง ชายผู้ที่นำพาเส้นทางให้พวกเรา
ความลับที่อยู่เบื้องหลังความสำเร็จของ Taktarov ก็คือการมุ่งหน้าไปสู่เป้าหมายแบบทันที
เปิดเผยทุกด้านของความสำเร็จคุณ !
ค้นพบ, พยายาม, ผิดพลาดได้ แต่อย่าพึ่งหยุดยั่ง !
InstaSpot ที่พร้อมจะเป็นจุดเริ่มต้น เรื่องราวความสำเร็จของคุณ !

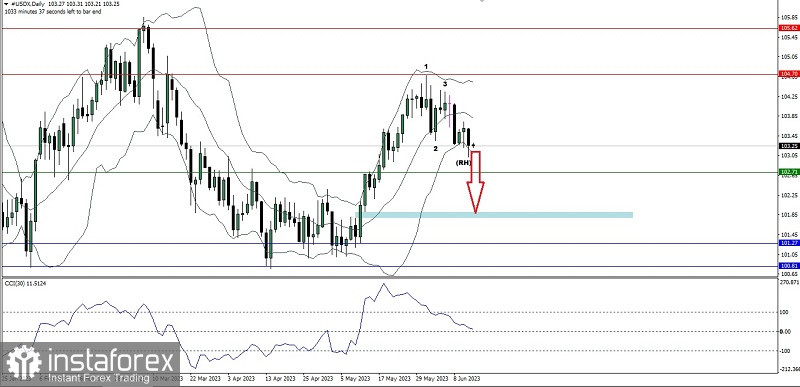
On the daily chart of the United States Dollar Index, you can see the appearance of a Bearish 123 pattern followed by a Bearish Ross Hook (RH) where currently USDX is trying to break below the 103.02 level. If it is successfully broken, then USDX will find a significant support level at 102.71 which has been confirmed. by CCI (30) which is heading to level 0, but if it is successfully broken it is not impossible for USDX to continue its depreciation to the level of the Bullish Fair Value Gap area at the level of the 101.91-101.78 area with a note that during the way down there was no upward correction that exceeded the level 104.10 because if this level is broken above then all the downward scenarios previously described will become invalid and cancel automatically.
(Disclaimer)
*บทวิเคราะห์ในตลาดที่มีการโพสต์ตรงนี้ เพียงเพื่อทำให้คุณทราบถึงข้อมูล ไม่ได้เป็นการเจาะจงถึงขั้นตอนให้คุณทำการซื้อขายตาม
บทวิเคราะห์ของทาง InstaSpot จะทำให้คุณทราบถึงแนวโน้มของตลาด! ในการที่เป็นลูกค้าของทาง InstaSpot นั้นคุณจะได้รับการบริการเพื่อการซื้อขายอย่างเต็มประสิทธิภาพอย่างมากมาย


