


The legend in the InstaSpot team!
Legend! You think that's bombastic rhetoric? But how should we call a man, who became the first Asian to win the junior world chess championship at 18 and who became the first Indian Grandmaster at 19? That was the start of a hard path to the World Champion title for Viswanathan Anand, the man who became a part of history of chess forever. Now one more legend in the InstaSpot team!


Borussia is one of the most titled football clubs in Germany, which has repeatedly proved to fans: the spirit of competition and leadership will certainly lead to success. Trade in the same way that sports professionals play the game: confidently and actively. Keep a "pass" from Borussia FC and be in the lead with InstaSpot!
Trend analysis (fig. 1).
The pair may climb to 1.2199, the Fibonacci retracement level of 61.8% (blue dotted line) from 1.2108, the closing of yesterday's daily candlestick. After reaching this level, it is likely to retreat to 1.2140, the Fibonacci retracement level of 14.6% (yellow dotted line).
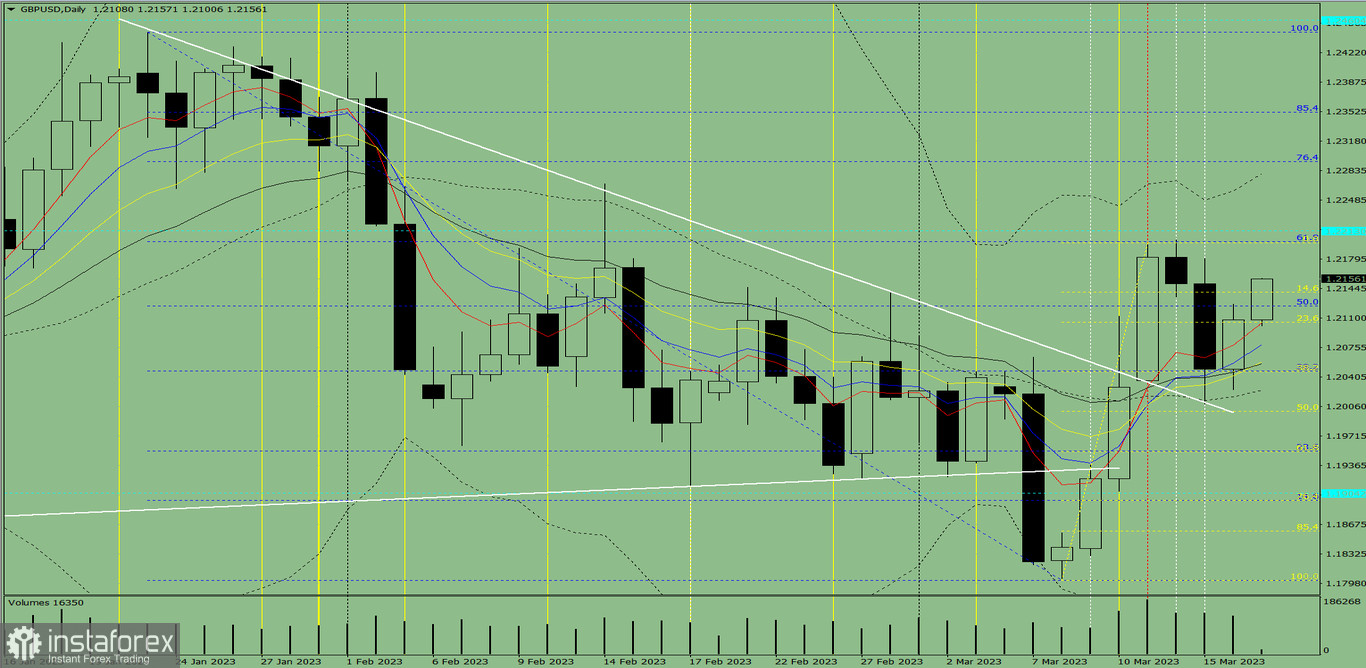
Fig. 1 (intraday chart).
Complex analysis:
- indicator analysis– up;
- Fibonacci levels – up;
- trading volumes – up;
- candlestick analysis – up;
- trend analysis – up;
- Bollinger lines – up;
- weekly chart - up.
Conclusion:
The pair may climb to 1.2199, the Fibonacci retracement level of 61.8% (blue dotted line) from 1.2108, the closing of yesterday's daily candlestick. After reaching this level, it is likely to retreat to 1.2140, the Fibonacci retracement level of 14.6% (yellow dotted line).
Alternatively, the price may move to 1.2199, the Fibonacci retracement level of 61.8% (blue dotted line) from 1.2108, the closing of yesterday's daily candlestick. After hitting this level, the price may rise higher.
*这里的市场分析是为了增加您对市场的了解,而不是给出交易的指示。
InstaSpot分析评论将让您充分了解市场趋势! 作为InstaSpot的客户,您将获得大量的免费服务以实现有效的交易。


