


Our team has over 7,000,000 traders!
Every day we work together to improve trading. We get high results and move forward.
Recognition by millions of traders all over the world is the best appreciation of our work! You made your choice and we will do everything it takes to meet your expectations!
We are a great team together!
InstaSpot. Proud to work for you!


Actor, UFC 6 tournament champion and a true hero!
The man who made himself. The man that goes our way.
The secret behind Taktarov's success is constant movement towards the goal.
Reveal all the sides of your talent!
Discover, try, fail - but never stop!
InstaSpot. Your success story starts here!

Trend analysis (fig. 1).
The pair may climb to 1.2199, the Fibonacci retracement level of 61.8% (blue dotted line) from 1.2108, the closing of yesterday's daily candlestick. After reaching this level, it is likely to retreat to 1.2140, the Fibonacci retracement level of 14.6% (yellow dotted line).
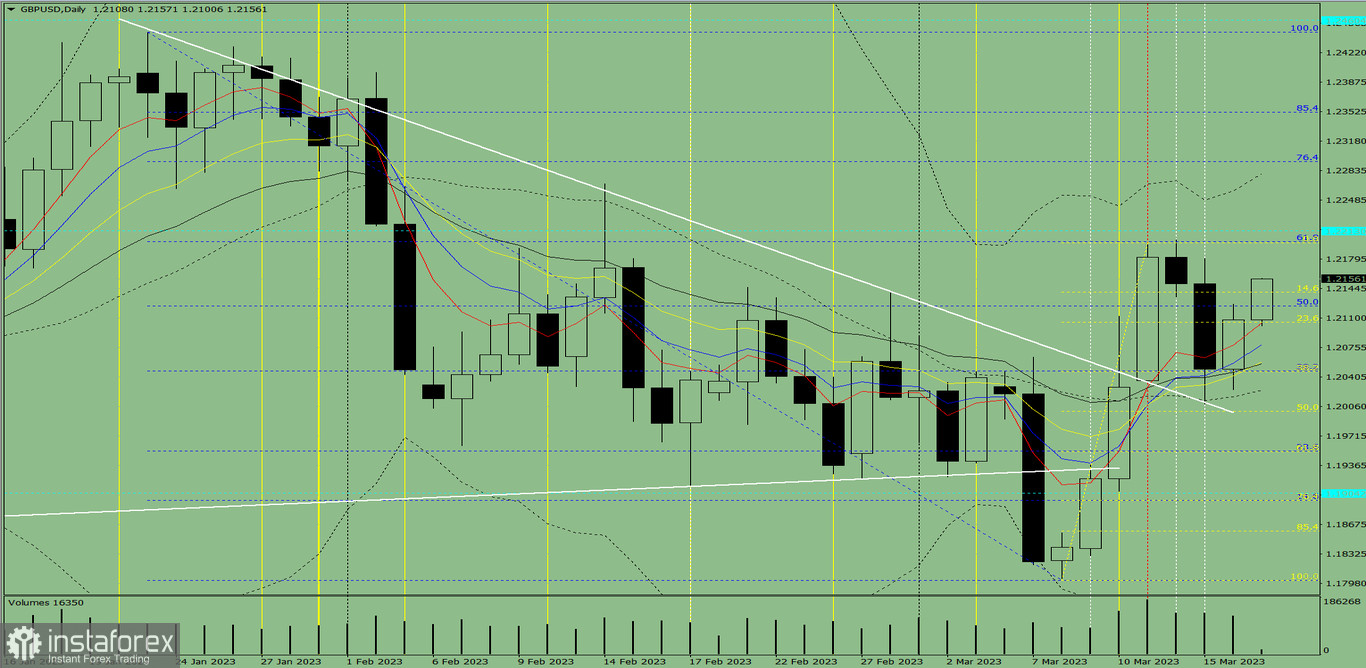
Fig. 1 (intraday chart).
Complex analysis:
- indicator analysis– up;
- Fibonacci levels – up;
- trading volumes – up;
- candlestick analysis – up;
- trend analysis – up;
- Bollinger lines – up;
- weekly chart - up.
Conclusion:
The pair may climb to 1.2199, the Fibonacci retracement level of 61.8% (blue dotted line) from 1.2108, the closing of yesterday's daily candlestick. After reaching this level, it is likely to retreat to 1.2140, the Fibonacci retracement level of 14.6% (yellow dotted line).
Alternatively, the price may move to 1.2199, the Fibonacci retracement level of 61.8% (blue dotted line) from 1.2108, the closing of yesterday's daily candlestick. After hitting this level, the price may rise higher.
*এখানে পোস্ট করা মার্কেট বিশ্লেষণ আপনার সচেতনতা বৃদ্ধির জন্য প্রদান করা হয়, ট্রেড করার নির্দেশনা প্রদানের জন্য প্রদান করা হয় না।
ইন্সটাফরেক্স বিশ্লেষণমূলক পর্যালোচনাগুলো আপনাকে মার্কেট প্রবণতা সম্পর্কে পুরোপুরি সচেতন করবে! ইন্সটাফরেক্সের একজন গ্রাহক হওয়ায়, দক্ষ ট্রেডিং এর জন্য আপনাকে অনেক সেবা বিনামূল্যে প্রদান করা হয়।


