


ตำนานแห่งทีม InstaSpot!
ที่สุด! คุณคิดว่าอะไรคือการทำให้รู้สึกฮึกเหิมกันละ? แต่พวกเราควรจะเรียกคนที่กลายมาเป็นชาวเอเชียคนแรกที่คว้าแชมป์หมากรุกระดับโลกรุ่นเยาวชนอายุ 18 ปี และยังกลายมาเป็นแกรนด์มาสเตอร์ชาวอินเดียคนแรกด้วยอายุ 19ปีเท่านั้น? นั้นเป็นจุดเริ่มต้นของเส้นทางสู่การเป็นแชมป์โลกสำหรับคุณ Viswanathan Anand คนที่กลายมาเป็นส่วนหนึ่งในหน้าประวติศาสตร์หมากรุกไปตลาดกาล ตอนนี้ก็มีอีกตำนานมาอยู่ในทีม InstaSpot แล้ว!


Borussia เป็นหนึ่งในสโมสรฟุตบอลขึ้นชื่อในประเทศเยอรมนี ที่ได้พิสูจน์ให้กับเหล่าแฟนๆเห็นแล้วถึงจิตวิญญาณของการแข่งขัน และการขึ้นมาสู่จุดสูงสุด เพื่อจะมุ่งหน้าสู่ความสำเร็จ การเทรดเองก็เหมือนกับการเล่นกีฬาอย่างมืออาชีพในการแข่งขัน โดยต้องมีความมั่นใจและการไม่หยุดนิ่ง เพื่อที่จะได้ "ผ่าน" จากสโมสร Borussia FC และขึ้นมาอยู่ในอันดับต้นไปพร้อมกับ InstaSpot!

Trend analysis (fig. 1).
The pair may climb to 1.2199, the Fibonacci retracement level of 61.8% (blue dotted line) from 1.2108, the closing of yesterday's daily candlestick. After reaching this level, it is likely to retreat to 1.2140, the Fibonacci retracement level of 14.6% (yellow dotted line).
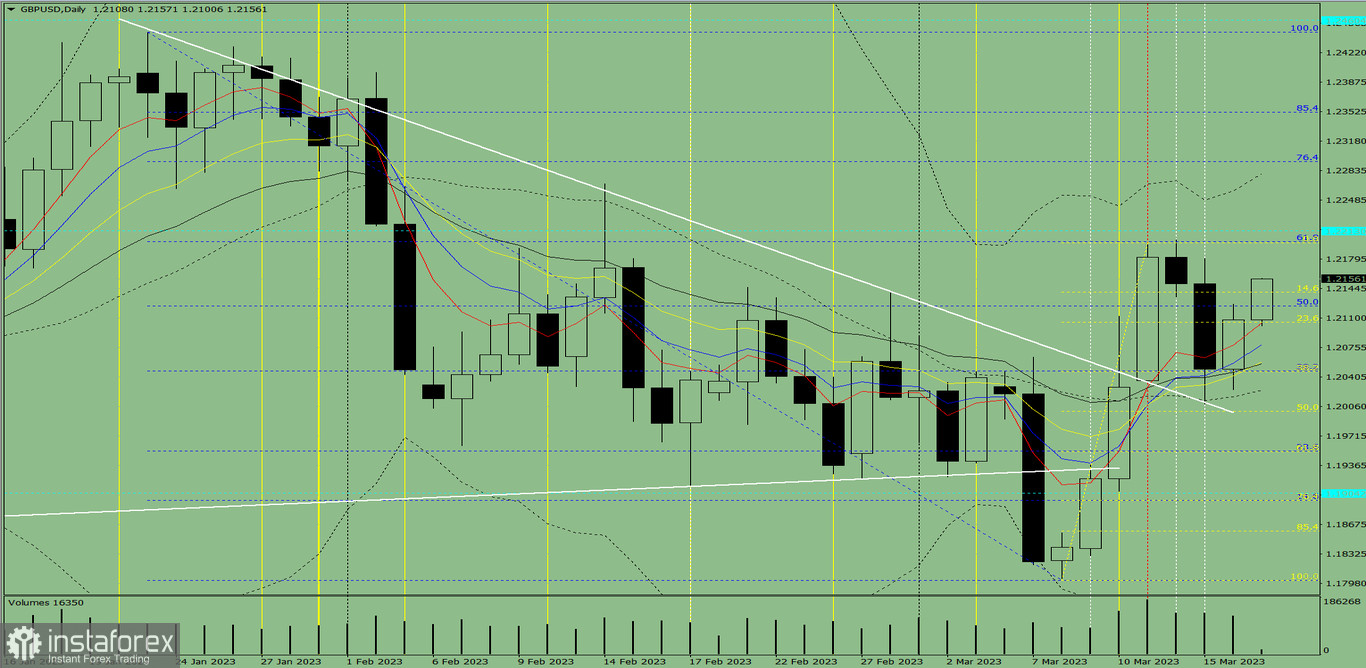
Fig. 1 (intraday chart).
Complex analysis:
- indicator analysis– up;
- Fibonacci levels – up;
- trading volumes – up;
- candlestick analysis – up;
- trend analysis – up;
- Bollinger lines – up;
- weekly chart - up.
Conclusion:
The pair may climb to 1.2199, the Fibonacci retracement level of 61.8% (blue dotted line) from 1.2108, the closing of yesterday's daily candlestick. After reaching this level, it is likely to retreat to 1.2140, the Fibonacci retracement level of 14.6% (yellow dotted line).
Alternatively, the price may move to 1.2199, the Fibonacci retracement level of 61.8% (blue dotted line) from 1.2108, the closing of yesterday's daily candlestick. After hitting this level, the price may rise higher.
*บทวิเคราะห์ในตลาดที่มีการโพสต์ตรงนี้ เพียงเพื่อทำให้คุณทราบถึงข้อมูล ไม่ได้เป็นการเจาะจงถึงขั้นตอนให้คุณทำการซื้อขายตาม
บทวิเคราะห์ของทาง InstaSpot จะทำให้คุณทราบถึงแนวโน้มของตลาด! ในการที่เป็นลูกค้าของทาง InstaSpot นั้นคุณจะได้รับการบริการเพื่อการซื้อขายอย่างเต็มประสิทธิภาพอย่างมากมาย


