


我们的团队有超过700万的操盘手!
我们每天都在一起努力改善交易。我们得到了很高的成绩,并继续前进。
世界各地数以百万计的操盘手的认可是我们工作的最大赞赏! 您做出了您的选择,我们将尽一切努力来满足您的期望!
我们是一个共同的伟大团队!
InstaSpot. 自豪地为您工作!


Monday was traditionally accompanied by an empty macroeconomic calendar. Therefore, there were no strong price fluctuations on the market. The day passed quite calmly.
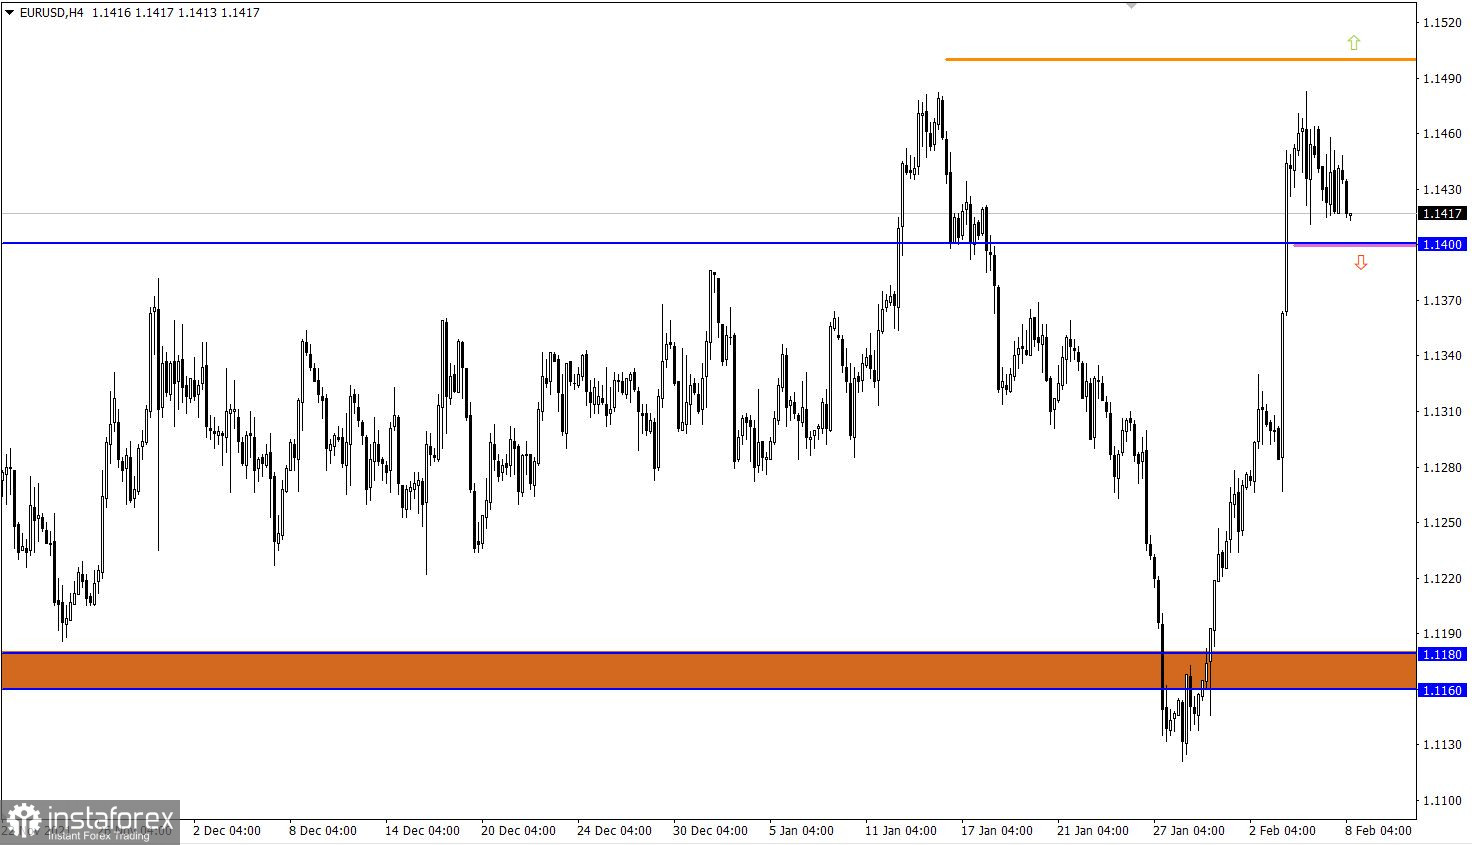
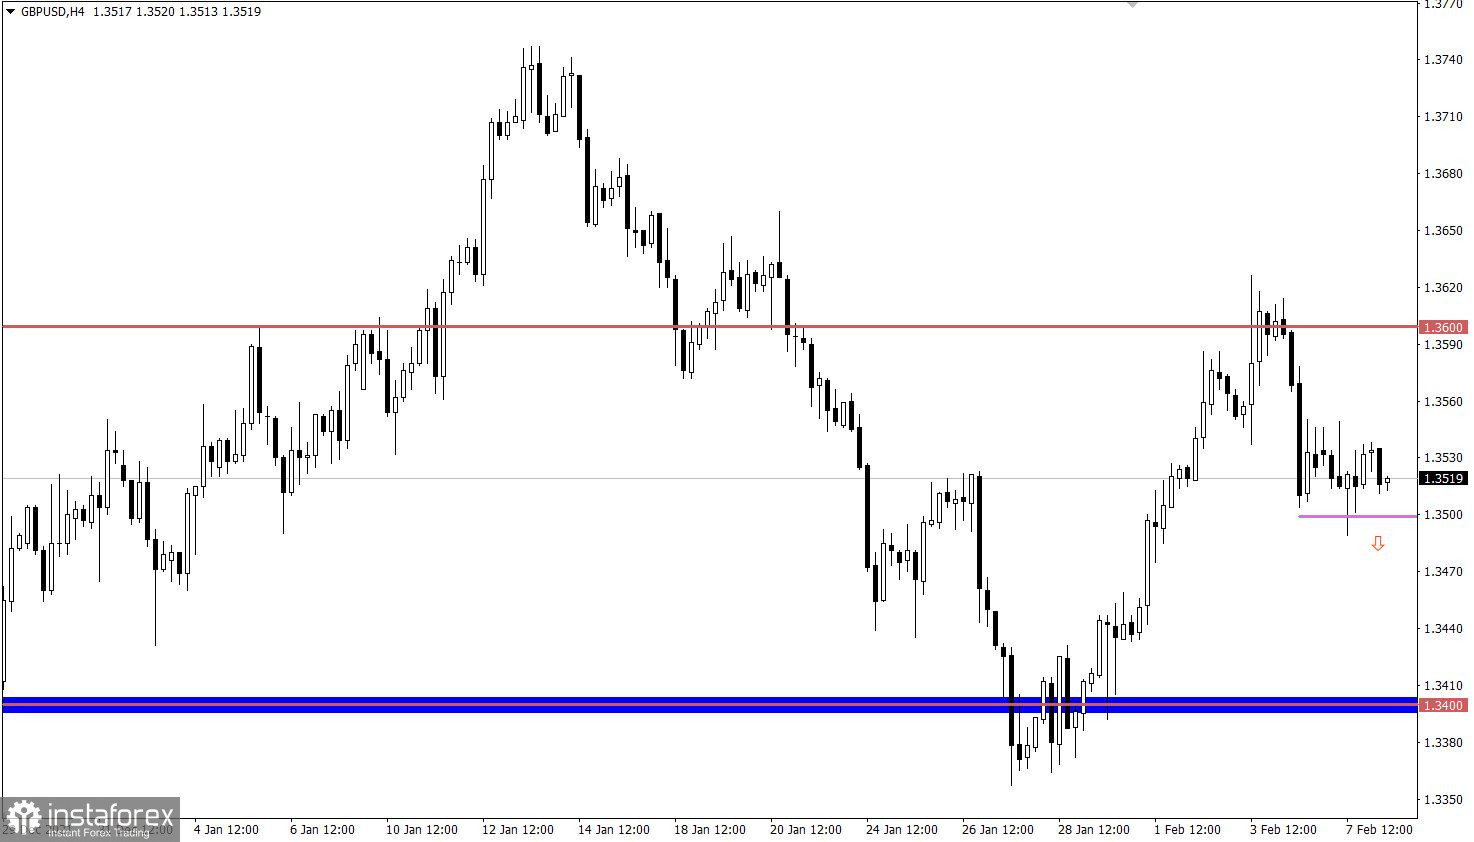
Analysis of trading charts from February 7:
Traders on the EUR/USD pair rebounded from the local high on January 14 to the nearest point. This led to a slowdown in the upward cycle and, as a result, to a lateral amplitude in the range of 1.1410/1.1480.
The GBP/USD pair rebounded from the resistance level of 1.3600, which resulted in a partial recovery move relative to the recent upward cycle.
February 8 economic calendar:
Today's macroeconomic calendar is not much different from Monday, it is still empty. In this case, special attention will be paid to the information flow and technical analysis.
Trading plan for EUR/USD on Feb 8:
The price stagnation in the amplitude of 1.1410/1.1480 will end shortly. In this situation, the best trading tactic is considered to be a breakdown of one or another stagnation border.
Therefore, the trading recommendations based on the above strategy remain the same.
Buy positions should be considered after holding the price above the level of 1.1485 with the prospect of moving to 1.1580.
Sell positions should be considered after holding the price below the level of 1.1400 with the prospect of moving to 1.1350-1.1300.
Trading plan for GBP/USD on Feb 8:
In this situation, holding the price below the level of 1.3500 in an H4 period will increase the chances of sellers further weakening the pound's value towards the level of 1.3450. Otherwise, the stagnation within 1.3500 may be delayed, which will disrupt the process of restoring dollar positions.
What is reflected in the trading charts?
A candlestick chart view is graphical rectangles of white and black light, with sticks on top and bottom. When analyzing each candle in detail, you will see its characteristics of a relative period: the opening price, closing price, and maximum and minimum prices.
Horizontal levels are price coordinates, relative to which a stop or a price reversal may occur. These levels are called support and resistance in the market.
Circles and rectangles are highlighted examples where the price of the story unfolded. This color selection indicates horizontal lines that may put pressure on the quote in the future.
The up/down arrows are the reference points of the possible price direction in the future.
*这里的市场分析是为了增加您对市场的了解,而不是给出交易的指示。
InstaSpot分析评论将让您充分了解市场趋势! 作为InstaSpot的客户,您将获得大量的免费服务以实现有效的交易。


