


Нашият екип има над 7 000 000 търговци!
Всеки ден работим заедно, за да подобрим търговията. Получаваме високи резултати и напредваме.
Признанието от милионите търговци по целия свят е най-доброто признание за нашата работа! Направихте своя избор и ние ще направим всичко, което е необходимо, за да отговорим на вашите очаквания!
Ние сме един страхотен екип заедно!
ИнстаФорекс. Горд съм да работя за вас!


Актьор, шампион на UFC 6 турнира и истински герой!
Човекът, който изгради себе си. Човекът, който върви по пътя ни.
Тайната зад успеха на Тактаров е постоянно движение към целта.
Открийте всички страни на вашия талант!
Откривайте, опитвайте, проваляйте се - но никога не спирайте!
ИнстаФорекс. Вашата успешна история започва тук!

Monday was traditionally accompanied by an empty macroeconomic calendar. Therefore, there were no strong price fluctuations on the market. The day passed quite calmly.
Analysis of trading charts from February 7:
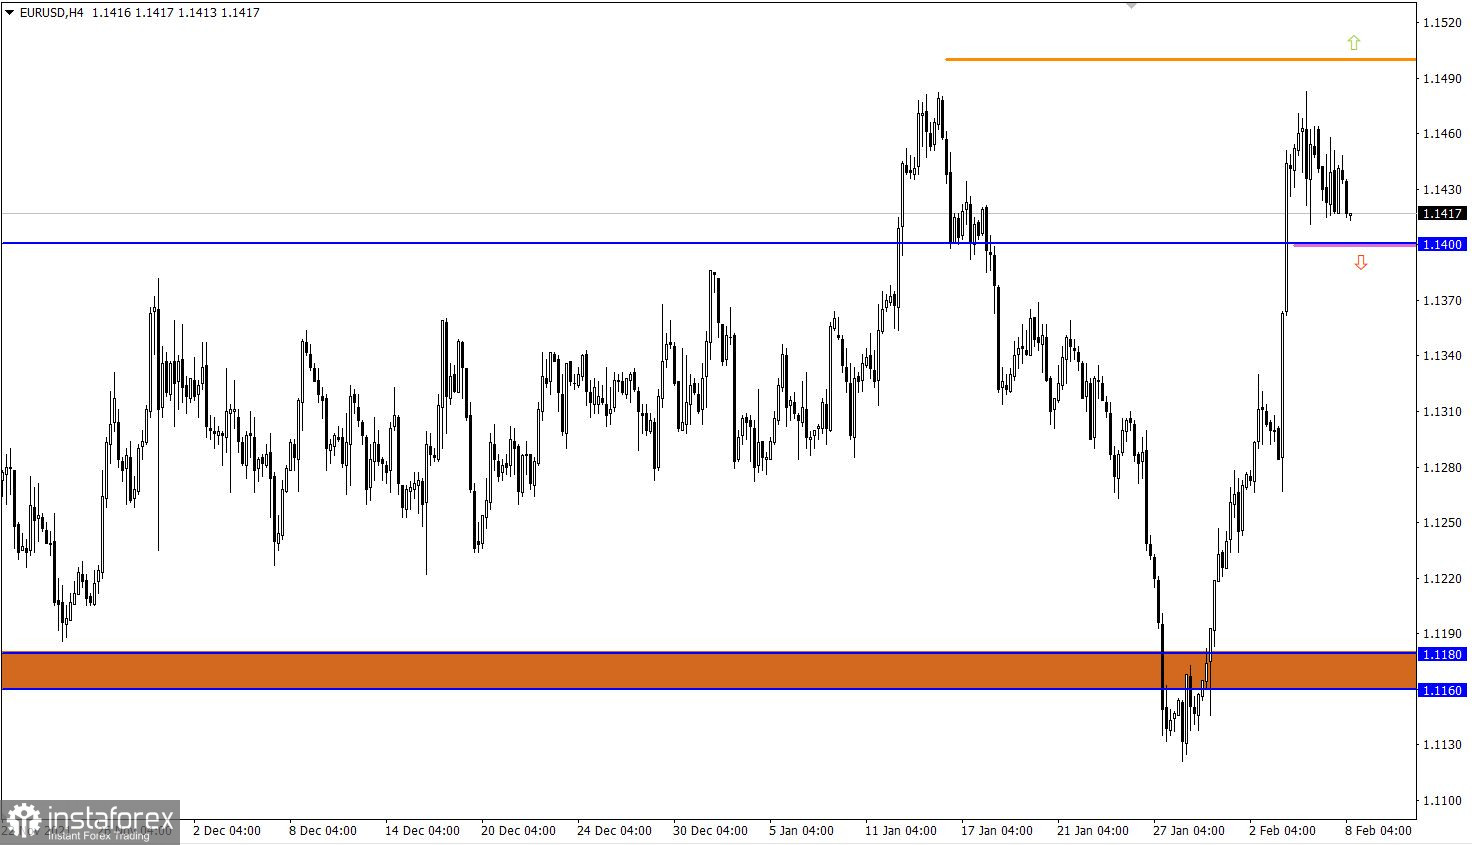
Traders on the EUR/USD pair rebounded from the local high on January 14 to the nearest point. This led to a slowdown in the upward cycle and, as a result, to a lateral amplitude in the range of 1.1410/1.1480.
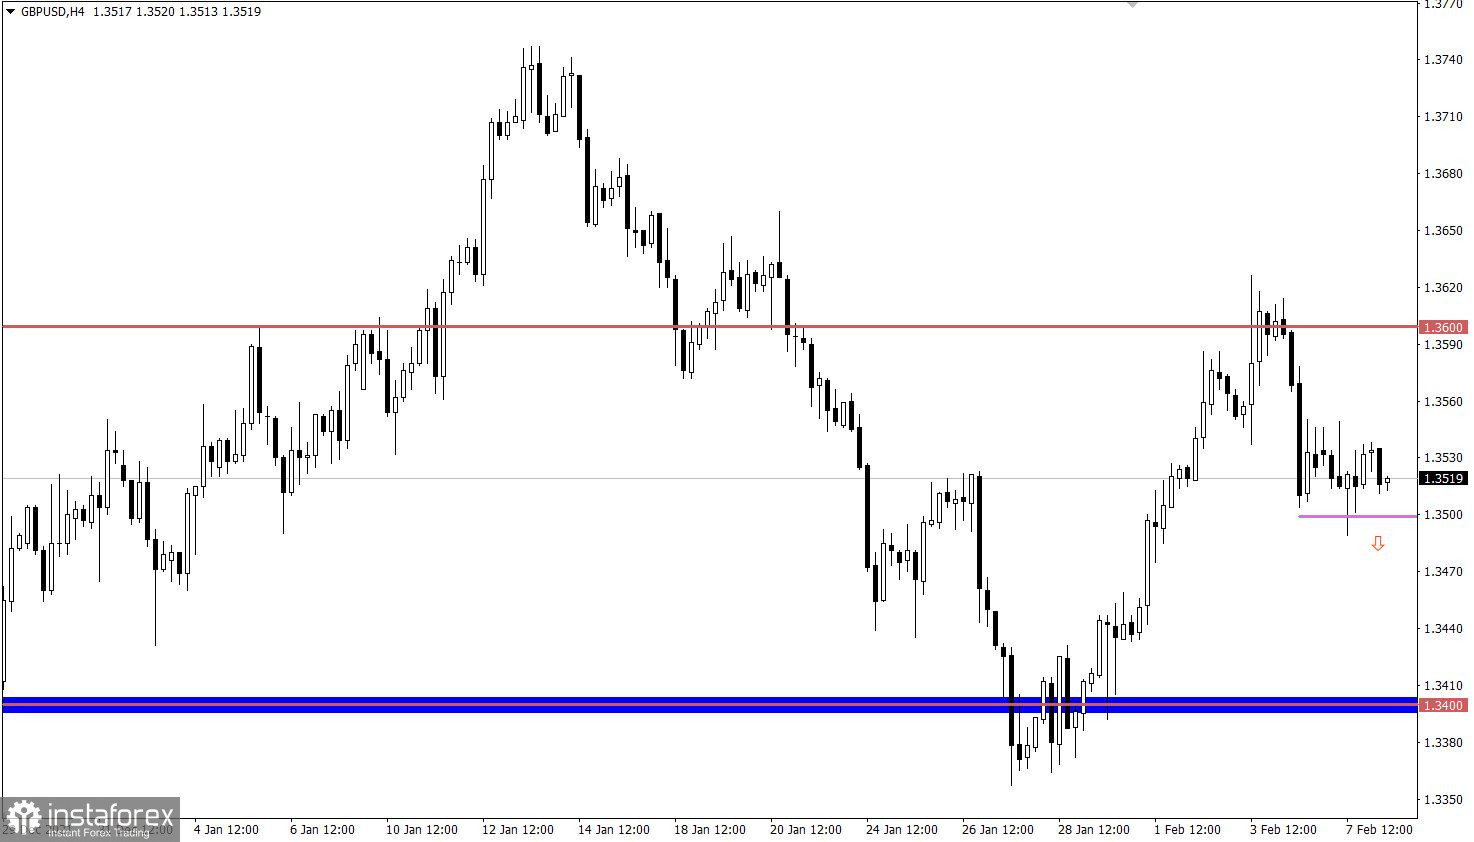
The GBP/USD pair rebounded from the resistance level of 1.3600, which resulted in a partial recovery move relative to the recent upward cycle.
February 8 economic calendar:
Today's macroeconomic calendar is not much different from Monday, it is still empty. In this case, special attention will be paid to the information flow and technical analysis.
Trading plan for EUR/USD on Feb 8:
The price stagnation in the amplitude of 1.1410/1.1480 will end shortly. In this situation, the best trading tactic is considered to be a breakdown of one or another stagnation border.
Therefore, the trading recommendations based on the above strategy remain the same.
Buy positions should be considered after holding the price above the level of 1.1485 with the prospect of moving to 1.1580.
Sell positions should be considered after holding the price below the level of 1.1400 with the prospect of moving to 1.1350-1.1300.
Trading plan for GBP/USD on Feb 8:
In this situation, holding the price below the level of 1.3500 in an H4 period will increase the chances of sellers further weakening the pound's value towards the level of 1.3450. Otherwise, the stagnation within 1.3500 may be delayed, which will disrupt the process of restoring dollar positions.
What is reflected in the trading charts?
A candlestick chart view is graphical rectangles of white and black light, with sticks on top and bottom. When analyzing each candle in detail, you will see its characteristics of a relative period: the opening price, closing price, and maximum and minimum prices.
Horizontal levels are price coordinates, relative to which a stop or a price reversal may occur. These levels are called support and resistance in the market.
Circles and rectangles are highlighted examples where the price of the story unfolded. This color selection indicates horizontal lines that may put pressure on the quote in the future.
The up/down arrows are the reference points of the possible price direction in the future.
*Анализът на пазара публикуван тук има за цел да повиши информираността Ви, но не и да дава указания за търговия.
Аналитичните прегледи на ИнстаФорекс ще ви запознаят изцяло с пазарните тенденции! Като клиент на ИнстаФорекс, на вас се предоставят голям брой безплатни услуги за ефикасна търговия.


