




الأسطورة فى فريق إنستافوركس!
الأسطورة! هل تعتقد أن هذا هو الخطاب المنمق؟ ولكن كيف ينبغي أن نطلق على الرجل، الذي أصبح أول آسيوي يفوز ببطولة العالم للشطرنج للشباب بعمر 18 سنة والذي أصبح أول أستاذ كبير هندي في سن 19؟ وكانت هذه بداية طريق صعب إلى لقب بطل العالم لـ فيسواناثان أناند، الرجل الذي أصبح جزءًا من تاريخ الشطرنج إلى الأبد. والآن أسطورة آخر في فريق إنستافوركس!





يعتبر بوروسيا دورتموند أحد أكثر أندية كرة القدم حصولاً على الألقاب في ألمانيا، وقد أثبت ذلك مرارًا وتكرارًا للجماهير: فإنّ روح المنافسة والقيادة ستؤدي بالتأكيد إلى النجاح. قم بالتداول بنفس الطريقة التي يلعب بها المحترفون الرياضيون اللعبة: بثقة ونشاط. احتفظ بـ "ترخيص دخول" من نادي بوروسيا دورتموند لكرة القدم وكن في الصدارة مع إنستافوركس!
Monday was traditionally accompanied by an empty macroeconomic calendar. Therefore, there were no strong price fluctuations on the market. The day passed quite calmly.
Analysis of trading charts from February 7:
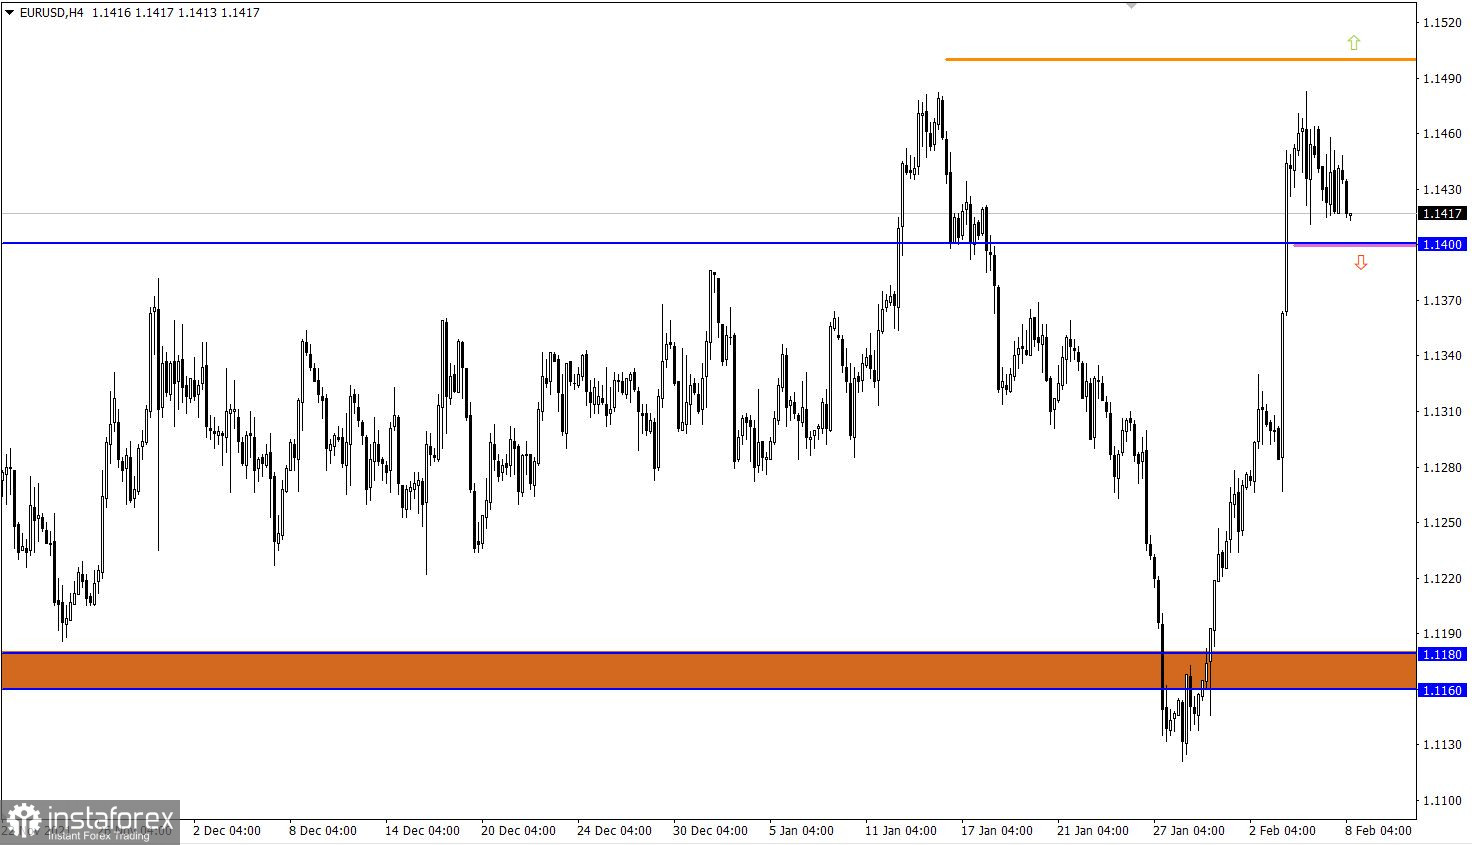
Traders on the EUR/USD pair rebounded from the local high on January 14 to the nearest point. This led to a slowdown in the upward cycle and, as a result, to a lateral amplitude in the range of 1.1410/1.1480.
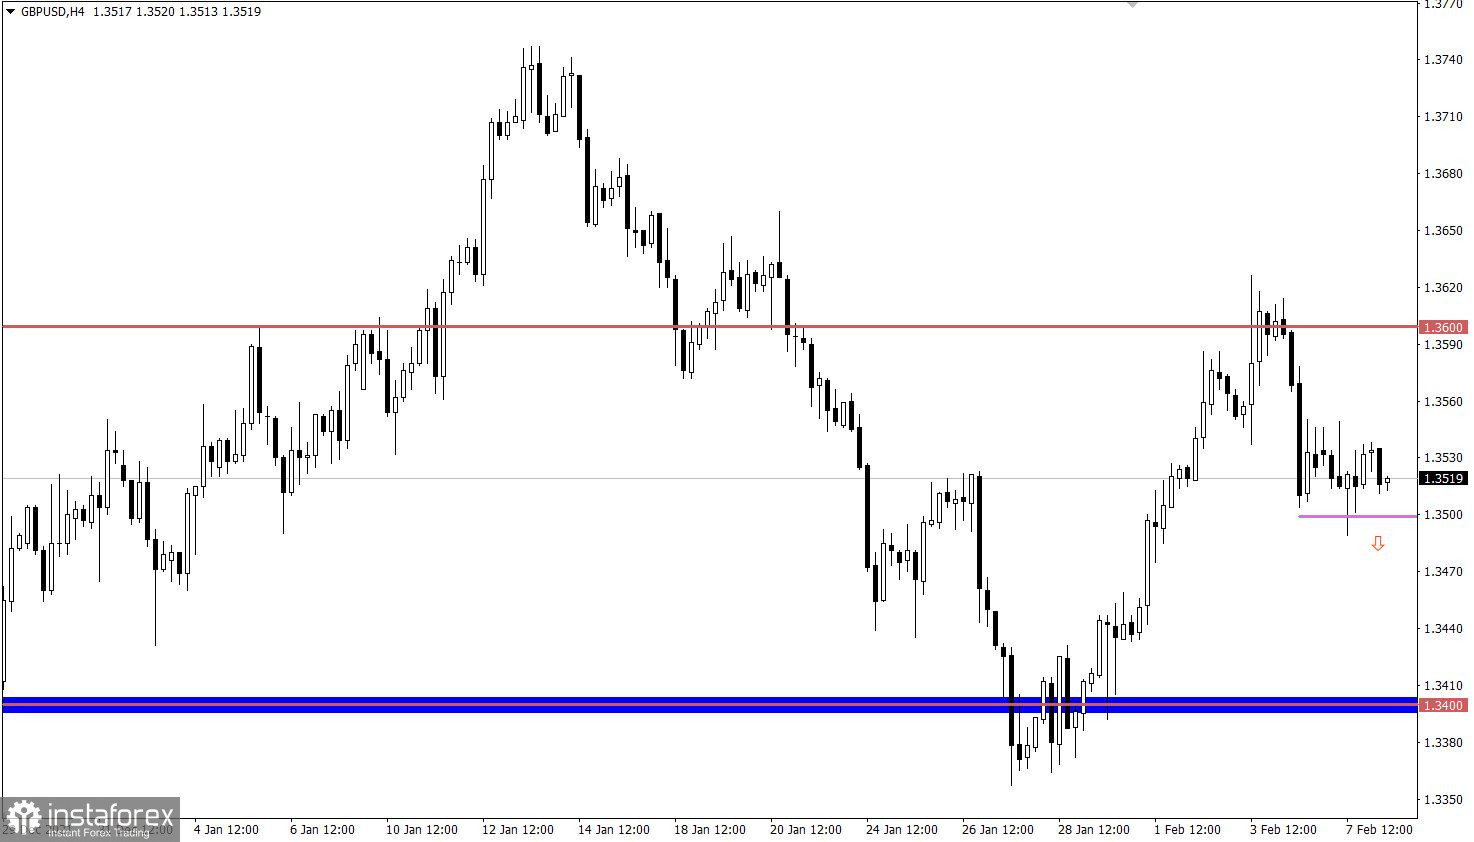
The GBP/USD pair rebounded from the resistance level of 1.3600, which resulted in a partial recovery move relative to the recent upward cycle.
February 8 economic calendar:
Today's macroeconomic calendar is not much different from Monday, it is still empty. In this case, special attention will be paid to the information flow and technical analysis.
Trading plan for EUR/USD on Feb 8:
The price stagnation in the amplitude of 1.1410/1.1480 will end shortly. In this situation, the best trading tactic is considered to be a breakdown of one or another stagnation border.
Therefore, the trading recommendations based on the above strategy remain the same.
Buy positions should be considered after holding the price above the level of 1.1485 with the prospect of moving to 1.1580.
Sell positions should be considered after holding the price below the level of 1.1400 with the prospect of moving to 1.1350-1.1300.
Trading plan for GBP/USD on Feb 8:
In this situation, holding the price below the level of 1.3500 in an H4 period will increase the chances of sellers further weakening the pound's value towards the level of 1.3450. Otherwise, the stagnation within 1.3500 may be delayed, which will disrupt the process of restoring dollar positions.
What is reflected in the trading charts?
A candlestick chart view is graphical rectangles of white and black light, with sticks on top and bottom. When analyzing each candle in detail, you will see its characteristics of a relative period: the opening price, closing price, and maximum and minimum prices.
Horizontal levels are price coordinates, relative to which a stop or a price reversal may occur. These levels are called support and resistance in the market.
Circles and rectangles are highlighted examples where the price of the story unfolded. This color selection indicates horizontal lines that may put pressure on the quote in the future.
The up/down arrows are the reference points of the possible price direction in the future.
*The market analysis posted here is meant to increase your awareness, but not to give instructions to make a trade.
InstaSpot analytical reviews will make you fully aware of market trends! Being an InstaSpot client, you are provided with a large number of free services for efficient trading.


