


Đội ngũ của chúng tôi có hơn 7,000,000 thương nhân!
Hàng ngày chúng tôi làm việc cùng nhau để cải thiện việc giao dịch. Chúng tôi nhận được kết quả cao và luôn tiến lên phía trước.
Sự công nhận của hàng triệu thương nhân trên toàn thế giới là sự đánh giá tốt nhất cho công việc của chúng tôi! Bạn đã đưa ra quyết định của mình và chúng tôi sẽ làm mọi thứ cần thiết để đáp ứng mong đợi của bạn!
Chúng ta cùng với nhau sẽ là một nhóm tuyệt vời!
InstaSpot. Tự hào làm việc cho bạn!


Diễn viên, nhà vô địch mùa giải UFC 6 và là người hùng thật sự!
Người tự mình làm nên tất cả. Người đàn ông đáng kể học hỏi.
Bí mật đằng sau thành công của Taktarov là sự cố gắng liên tục hướng tới mục tiêu.
Hãy khai phá tất cả các mặt tài năng của bạn!
Khám phá, thử, thất bại - nhưng không bao giờ dừng lại!
InstaSpot. Câu chuyện thành công của bạn bắt đầu từ đây!
Hello, dear traders!
In this article, we will analyze the technical picture of NZD/USD, which is now seen by many as the major currency pair along with EUR/USD, GBP/USD, USD/JPY, USD/CHF, and commodity pairs AUD/USD and USD/CAD. The Reserve Bank of New Zealand is going to tighten its monetary policy by hiking rates. Inflation in the country soared after the COVID-19 pandemic when energy and commodity prices spiked. So, let's begin with the weekly time frame of NZD/USD.
Weekly
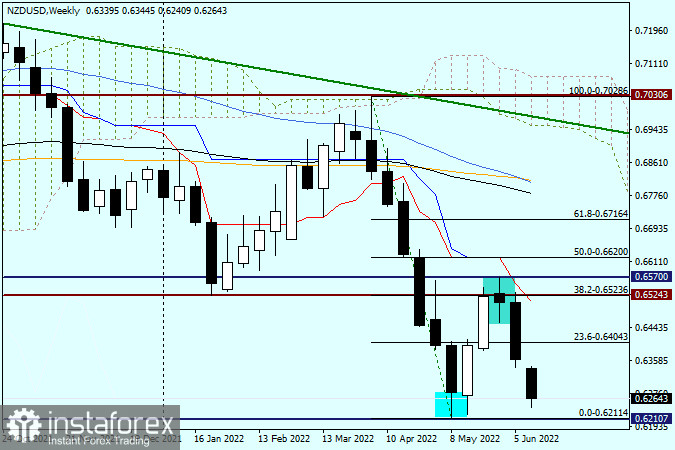
On the weekly chart, we can see the 0.6211 low and the highlighted lower shadow of the candlestick from which the kiwi started to retrace up. The fact the pair's upward move is just a correction is clearly seen thanks to the Fibonacci grid drawn between 0.7028 and 0.6211. As we can see, the quote went slightly above the Fibonacci retracement of 38.2 and then encountered strong resistance at 0.6570. As a result, a reversal candlestick pattern emerged on the weekly chart. At least it looks like a reversal pattern in terms of its shape. After the formation of this candlestick, a downward reversal occurred.
The pair showed strong movement last week, which only confirmed the reversal pattern. It is only Tuesday, but the quote is already moving down fast. The candlestick is now acquiring a lower shadow. However, ahead of the FOMC meeting and due to the fact it is only the beginning of the trading week, the technical picture may change dramatically. The one thing is clear so far – should the price close below the key support of 0.6211, bulls will be pushed off the market entirely. Alternatively, if the pair goes up, the bearish resistance of 0.6570 will be broken in case of a true breakout only. Anyway, both scenarios seem unlikely at this point.
Daily
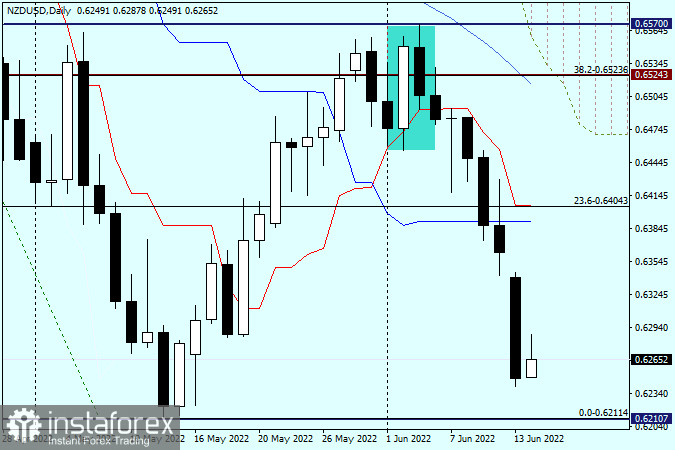
On the daily chart, a downward reversal of NZD/USD from the 0.6570 mark is clearly visible. It could be seen as the Harami candlestick pattern, consisting of two candlesticks. The second candlestick is bearish, and it should certainly be within the body of the previous white candlestick. The closing price of the white candlestick is 0.6550 and the open price of the bearish one is 0.6549. This means that the bearish candlestick formed on June 3rd is within the body of the previous bullish candlestick. As we can see, this is what the market needed to start selling aggressively. It should also be mentioned that the Harami reversal pattern is by no means the strongest one.
Today, the kiwi is trying to retrace up although the current daily candlestick looks not so good. So, it is wiser to go short today. Short positions could be opened after a true breakout at 0.6211 support with further consolidation and a bounce to the broken level. Likewise, they can be considered from 0.6400 after the quote has increased to the 0.6390-0.6405 range, where the red Tenkan Line of the Ichimoku indicator passes.
Good luck!
*Phân tích thị trường được đăng tải ở đây có nghĩa là để gia tăng nhận thức của bạn, nhưng không đưa ra các chỉ dẫn để thực hiện một giao dịch.
InstaSpot analytical reviews will make you fully aware of market trends! Being an InstaSpot client, you are provided with a large number of free services for efficient trading.


