


ตำนานแห่งทีม InstaSpot!
ที่สุด! คุณคิดว่าอะไรคือการทำให้รู้สึกฮึกเหิมกันละ? แต่พวกเราควรจะเรียกคนที่กลายมาเป็นชาวเอเชียคนแรกที่คว้าแชมป์หมากรุกระดับโลกรุ่นเยาวชนอายุ 18 ปี และยังกลายมาเป็นแกรนด์มาสเตอร์ชาวอินเดียคนแรกด้วยอายุ 19ปีเท่านั้น? นั้นเป็นจุดเริ่มต้นของเส้นทางสู่การเป็นแชมป์โลกสำหรับคุณ Viswanathan Anand คนที่กลายมาเป็นส่วนหนึ่งในหน้าประวติศาสตร์หมากรุกไปตลาดกาล ตอนนี้ก็มีอีกตำนานมาอยู่ในทีม InstaSpot แล้ว!


Borussia เป็นหนึ่งในสโมสรฟุตบอลขึ้นชื่อในประเทศเยอรมนี ที่ได้พิสูจน์ให้กับเหล่าแฟนๆเห็นแล้วถึงจิตวิญญาณของการแข่งขัน และการขึ้นมาสู่จุดสูงสุด เพื่อจะมุ่งหน้าสู่ความสำเร็จ การเทรดเองก็เหมือนกับการเล่นกีฬาอย่างมืออาชีพในการแข่งขัน โดยต้องมีความมั่นใจและการไม่หยุดนิ่ง เพื่อที่จะได้ "ผ่าน" จากสโมสร Borussia FC และขึ้นมาอยู่ในอันดับต้นไปพร้อมกับ InstaSpot!

Hello, dear traders!
In this article, we will analyze the technical picture of NZD/USD, which is now seen by many as the major currency pair along with EUR/USD, GBP/USD, USD/JPY, USD/CHF, and commodity pairs AUD/USD and USD/CAD. The Reserve Bank of New Zealand is going to tighten its monetary policy by hiking rates. Inflation in the country soared after the COVID-19 pandemic when energy and commodity prices spiked. So, let's begin with the weekly time frame of NZD/USD.
Weekly
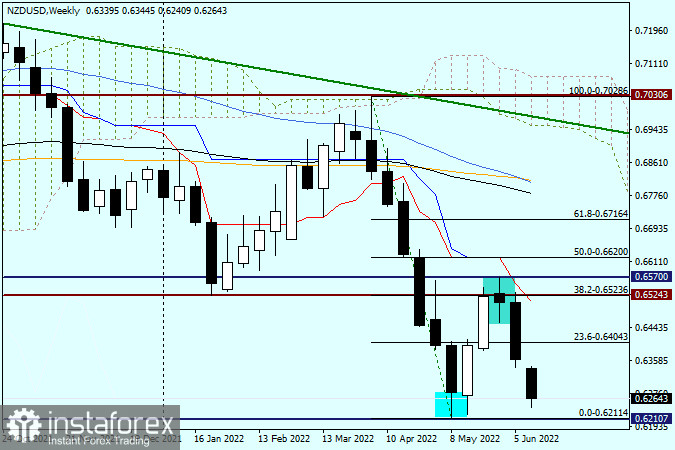
On the weekly chart, we can see the 0.6211 low and the highlighted lower shadow of the candlestick from which the kiwi started to retrace up. The fact the pair's upward move is just a correction is clearly seen thanks to the Fibonacci grid drawn between 0.7028 and 0.6211. As we can see, the quote went slightly above the Fibonacci retracement of 38.2 and then encountered strong resistance at 0.6570. As a result, a reversal candlestick pattern emerged on the weekly chart. At least it looks like a reversal pattern in terms of its shape. After the formation of this candlestick, a downward reversal occurred.
The pair showed strong movement last week, which only confirmed the reversal pattern. It is only Tuesday, but the quote is already moving down fast. The candlestick is now acquiring a lower shadow. However, ahead of the FOMC meeting and due to the fact it is only the beginning of the trading week, the technical picture may change dramatically. The one thing is clear so far – should the price close below the key support of 0.6211, bulls will be pushed off the market entirely. Alternatively, if the pair goes up, the bearish resistance of 0.6570 will be broken in case of a true breakout only. Anyway, both scenarios seem unlikely at this point.
Daily
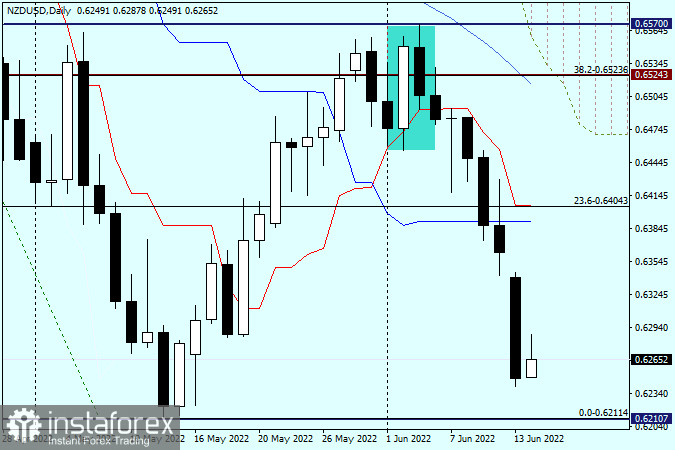
On the daily chart, a downward reversal of NZD/USD from the 0.6570 mark is clearly visible. It could be seen as the Harami candlestick pattern, consisting of two candlesticks. The second candlestick is bearish, and it should certainly be within the body of the previous white candlestick. The closing price of the white candlestick is 0.6550 and the open price of the bearish one is 0.6549. This means that the bearish candlestick formed on June 3rd is within the body of the previous bullish candlestick. As we can see, this is what the market needed to start selling aggressively. It should also be mentioned that the Harami reversal pattern is by no means the strongest one.
Today, the kiwi is trying to retrace up although the current daily candlestick looks not so good. So, it is wiser to go short today. Short positions could be opened after a true breakout at 0.6211 support with further consolidation and a bounce to the broken level. Likewise, they can be considered from 0.6400 after the quote has increased to the 0.6390-0.6405 range, where the red Tenkan Line of the Ichimoku indicator passes.
Good luck!
*บทวิเคราะห์ในตลาดที่มีการโพสต์ตรงนี้ เพียงเพื่อทำให้คุณทราบถึงข้อมูล ไม่ได้เป็นการเจาะจงถึงขั้นตอนให้คุณทำการซื้อขายตาม
บทวิเคราะห์ของทาง InstaSpot จะทำให้คุณทราบถึงแนวโน้มของตลาด! ในการที่เป็นลูกค้าของทาง InstaSpot นั้นคุณจะได้รับการบริการเพื่อการซื้อขายอย่างเต็มประสิทธิภาพอย่างมากมาย


