


Nossa equipe tem mais de 7,000,000 traders!
Todos os dias, trabalhamos juntos para melhorar a negociação. Obtivemos resultados elevados e avançamos.
O reconhecimento de milhões de traders em todo o mundo é a melhor apreciação do nosso trabalho! Você nos escolheu e faremos tudo o que for necessário para atender às suas expectativas!
Nós somos uma ótima equipe juntos!
InstaSpot. Orgulho de trabalhar para você!


Ator, hexacampeão do UFC e um verdadeiro herói!
Um homem de sucesso. Um homem que mostra o nosso caminho.
O segredo por trás do sucesso de Taktarov é um movimento constante em direção ao objetivo.
Revele todos os lados do seu talento!
Descubra, tente, falhe, mas nunca pare!
I InstaSpot. Sua história de sucesso começa aqui!
Hello, dear traders!
In this article, we will analyze the technical picture of NZD/USD, which is now seen by many as the major currency pair along with EUR/USD, GBP/USD, USD/JPY, USD/CHF, and commodity pairs AUD/USD and USD/CAD. The Reserve Bank of New Zealand is going to tighten its monetary policy by hiking rates. Inflation in the country soared after the COVID-19 pandemic when energy and commodity prices spiked. So, let's begin with the weekly time frame of NZD/USD.
Weekly
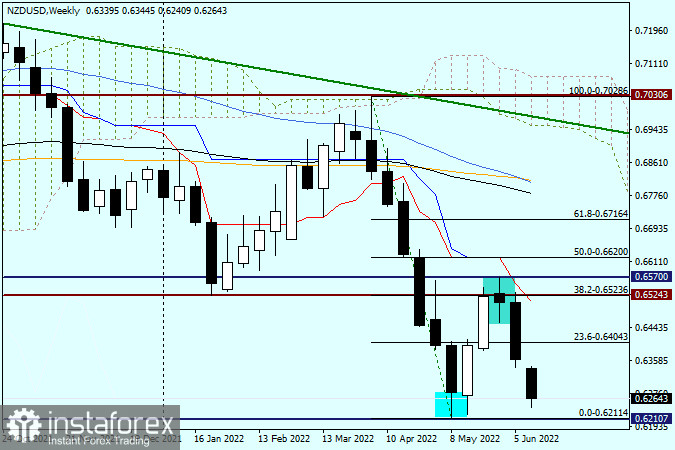
On the weekly chart, we can see the 0.6211 low and the highlighted lower shadow of the candlestick from which the kiwi started to retrace up. The fact the pair's upward move is just a correction is clearly seen thanks to the Fibonacci grid drawn between 0.7028 and 0.6211. As we can see, the quote went slightly above the Fibonacci retracement of 38.2 and then encountered strong resistance at 0.6570. As a result, a reversal candlestick pattern emerged on the weekly chart. At least it looks like a reversal pattern in terms of its shape. After the formation of this candlestick, a downward reversal occurred.
The pair showed strong movement last week, which only confirmed the reversal pattern. It is only Tuesday, but the quote is already moving down fast. The candlestick is now acquiring a lower shadow. However, ahead of the FOMC meeting and due to the fact it is only the beginning of the trading week, the technical picture may change dramatically. The one thing is clear so far – should the price close below the key support of 0.6211, bulls will be pushed off the market entirely. Alternatively, if the pair goes up, the bearish resistance of 0.6570 will be broken in case of a true breakout only. Anyway, both scenarios seem unlikely at this point.
Daily
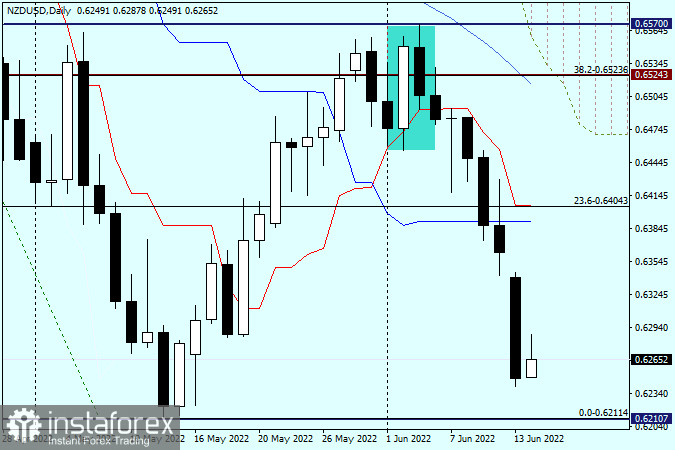
On the daily chart, a downward reversal of NZD/USD from the 0.6570 mark is clearly visible. It could be seen as the Harami candlestick pattern, consisting of two candlesticks. The second candlestick is bearish, and it should certainly be within the body of the previous white candlestick. The closing price of the white candlestick is 0.6550 and the open price of the bearish one is 0.6549. This means that the bearish candlestick formed on June 3rd is within the body of the previous bullish candlestick. As we can see, this is what the market needed to start selling aggressively. It should also be mentioned that the Harami reversal pattern is by no means the strongest one.
Today, the kiwi is trying to retrace up although the current daily candlestick looks not so good. So, it is wiser to go short today. Short positions could be opened after a true breakout at 0.6211 support with further consolidation and a bounce to the broken level. Likewise, they can be considered from 0.6400 after the quote has increased to the 0.6390-0.6405 range, where the red Tenkan Line of the Ichimoku indicator passes.
Good luck!
*A análise de mercado aqui postada destina-se a aumentar o seu conhecimento, mas não dar instruções para fazer uma negociação.
InstaSpot analytical reviews will make you fully aware of market trends! Being an InstaSpot client, you are provided with a large number of free services for efficient trading.


