


ตำนานแห่งทีม InstaSpot!
ที่สุด! คุณคิดว่าอะไรคือการทำให้รู้สึกฮึกเหิมกันละ? แต่พวกเราควรจะเรียกคนที่กลายมาเป็นชาวเอเชียคนแรกที่คว้าแชมป์หมากรุกระดับโลกรุ่นเยาวชนอายุ 18 ปี และยังกลายมาเป็นแกรนด์มาสเตอร์ชาวอินเดียคนแรกด้วยอายุ 19ปีเท่านั้น? นั้นเป็นจุดเริ่มต้นของเส้นทางสู่การเป็นแชมป์โลกสำหรับคุณ Viswanathan Anand คนที่กลายมาเป็นส่วนหนึ่งในหน้าประวติศาสตร์หมากรุกไปตลาดกาล ตอนนี้ก็มีอีกตำนานมาอยู่ในทีม InstaSpot แล้ว!


Borussia เป็นหนึ่งในสโมสรฟุตบอลขึ้นชื่อในประเทศเยอรมนี ที่ได้พิสูจน์ให้กับเหล่าแฟนๆเห็นแล้วถึงจิตวิญญาณของการแข่งขัน และการขึ้นมาสู่จุดสูงสุด เพื่อจะมุ่งหน้าสู่ความสำเร็จ การเทรดเองก็เหมือนกับการเล่นกีฬาอย่างมืออาชีพในการแข่งขัน โดยต้องมีความมั่นใจและการไม่หยุดนิ่ง เพื่อที่จะได้ "ผ่าน" จากสโมสร Borussia FC และขึ้นมาอยู่ในอันดับต้นไปพร้อมกับ InstaSpot!

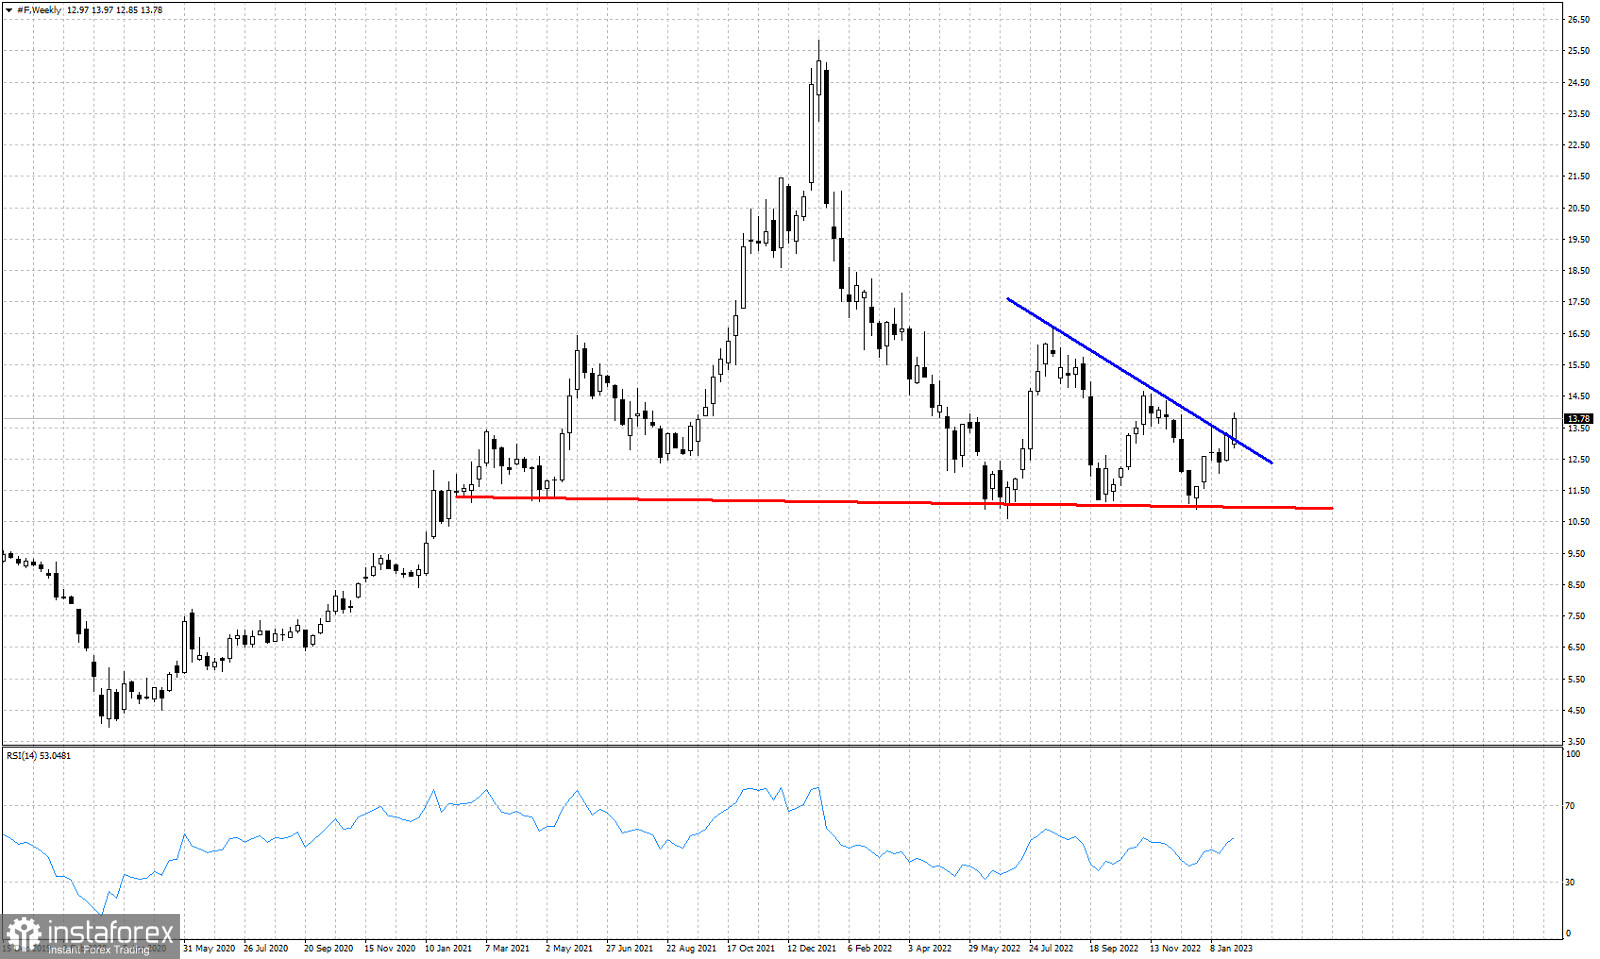
Red line- support neckline
Blue line- trend line resistance
After respecting key support around $11 and bouncing towards our short-term target at $13.50, Ford stock price has now managed on a weekly basis to break above the blue downward sloping resistance trend line. Having respected the horizontal support at $11 combined with a break above $13.50, we have a sign of strength and reversal after more than a year under pressure. Next important resistance is the previous high at $14.65. A break above this level will also cancel the Head and Shoulders bearish pattern.
*บทวิเคราะห์ในตลาดที่มีการโพสต์ตรงนี้ เพียงเพื่อทำให้คุณทราบถึงข้อมูล ไม่ได้เป็นการเจาะจงถึงขั้นตอนให้คุณทำการซื้อขายตาม
บทวิเคราะห์ของทาง InstaSpot จะทำให้คุณทราบถึงแนวโน้มของตลาด! ในการที่เป็นลูกค้าของทาง InstaSpot นั้นคุณจะได้รับการบริการเพื่อการซื้อขายอย่างเต็มประสิทธิภาพอย่างมากมาย


