


Tim kami memiliki lebih dari 7.000.000 trader!
Setiap harinya kami bekerja sama untuk meningkatkan trading. Kami memperoleh hasil tinggi dan terus bergerak maju.
Pengakuan dari jutaan trader diseluruh dunia merupakan apresiasi terbaik dari kerja kami! Anda membuat pilihan anda dan kami akan melakukan semua yang dibutuhkan untuk memenuhi ekspektasi anda!
We are a great team together!
InstaSpot. Bangga bekerja bersama anda!


Seorang Aktor, juara 6 turnamen UFC dan pahlawan sesungguhnya!
Pria yang berhasil. Pria yang berusaha keras.
Rahasia dibalik kesuksesan Taktarov adalah pergerakan konstan menuju target.
Tunjukkan seluruh sisi dari bakat anda!
Temukan, coba, gagal - namun jangan pernah berhenti!
InstaSpot. Cerita sukses anda dimulai disini!

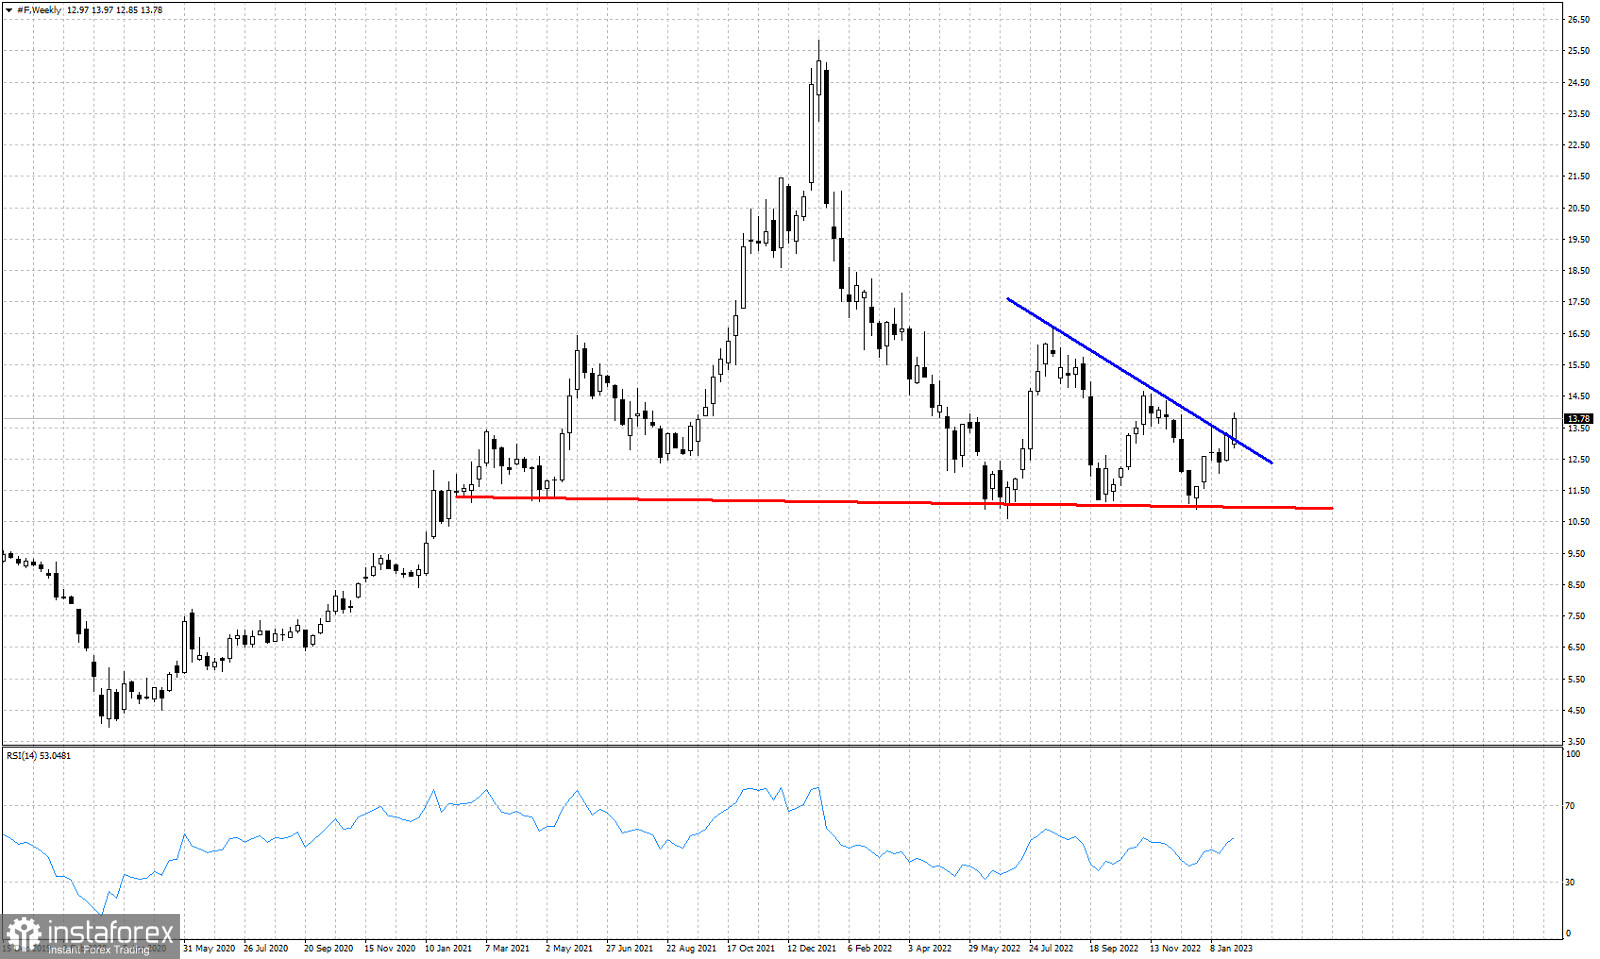
Red line- support neckline
Blue line- trend line resistance
After respecting key support around $11 and bouncing towards our short-term target at $13.50, Ford stock price has now managed on a weekly basis to break above the blue downward sloping resistance trend line. Having respected the horizontal support at $11 combined with a break above $13.50, we have a sign of strength and reversal after more than a year under pressure. Next important resistance is the previous high at $14.65. A break above this level will also cancel the Head and Shoulders bearish pattern.
*Analisis pasar yang diposting disini dimaksudkan untuk meningkatkan pengetahuan Anda namun tidak untuk memberi instruksi trading.
Tinjauan analitis InstaSpot akan membuat Anda menyadari sepenuhnya tren pasar! Sebagai klien InstaSpot, Anda dilengkapi dengan sejumlah besar layanan gratis untuk trading yang efisien.


