


InstaSpot टीम में लीजेंड!
लीजेंड! आपको लगता है कि धमाकेदार बयानबाजी है? लेकिन हमें एक आदमी को कैसे बुलाना चाहिए, जो 18 साल की जूनियर विश्व शतरंज चैंपियनशिप जीतने वाला पहला एशियाई बना और 19 में पहला भारतीय ग्रैंडमास्टर कौन बना? यह विश्वनाथन आनंद के लिए विश्व चैंपियन खिताब के लिए एक कठिन मार्ग की शुरुआत थी, जो उस व्यक्ति के लिए हमेशा के लिए शतरंज का इतिहास बन गया। अब InstaSpot टीम में एक और लीजेंड!


बोरूसिया जर्मनी में सबसे अधिक शीर्षक वाले फुटबॉल क्लबों में से एक है, जो प्रशंसकों के लिए बार-बार साबित हुआ है: प्रतियोगिता और नेतृत्व की भावना निश्चित रूप से सफलता की ओर ले जाएगी। उसी तरह से व्यापार जिसमें खेल पेशेवर खेल खेलते हैं: आत्मविश्वास से और सक्रिय रूप से। बोरूसिया FC से एक "पास" रखें और InstaSpot के साथ नेतृत्व में रहें!

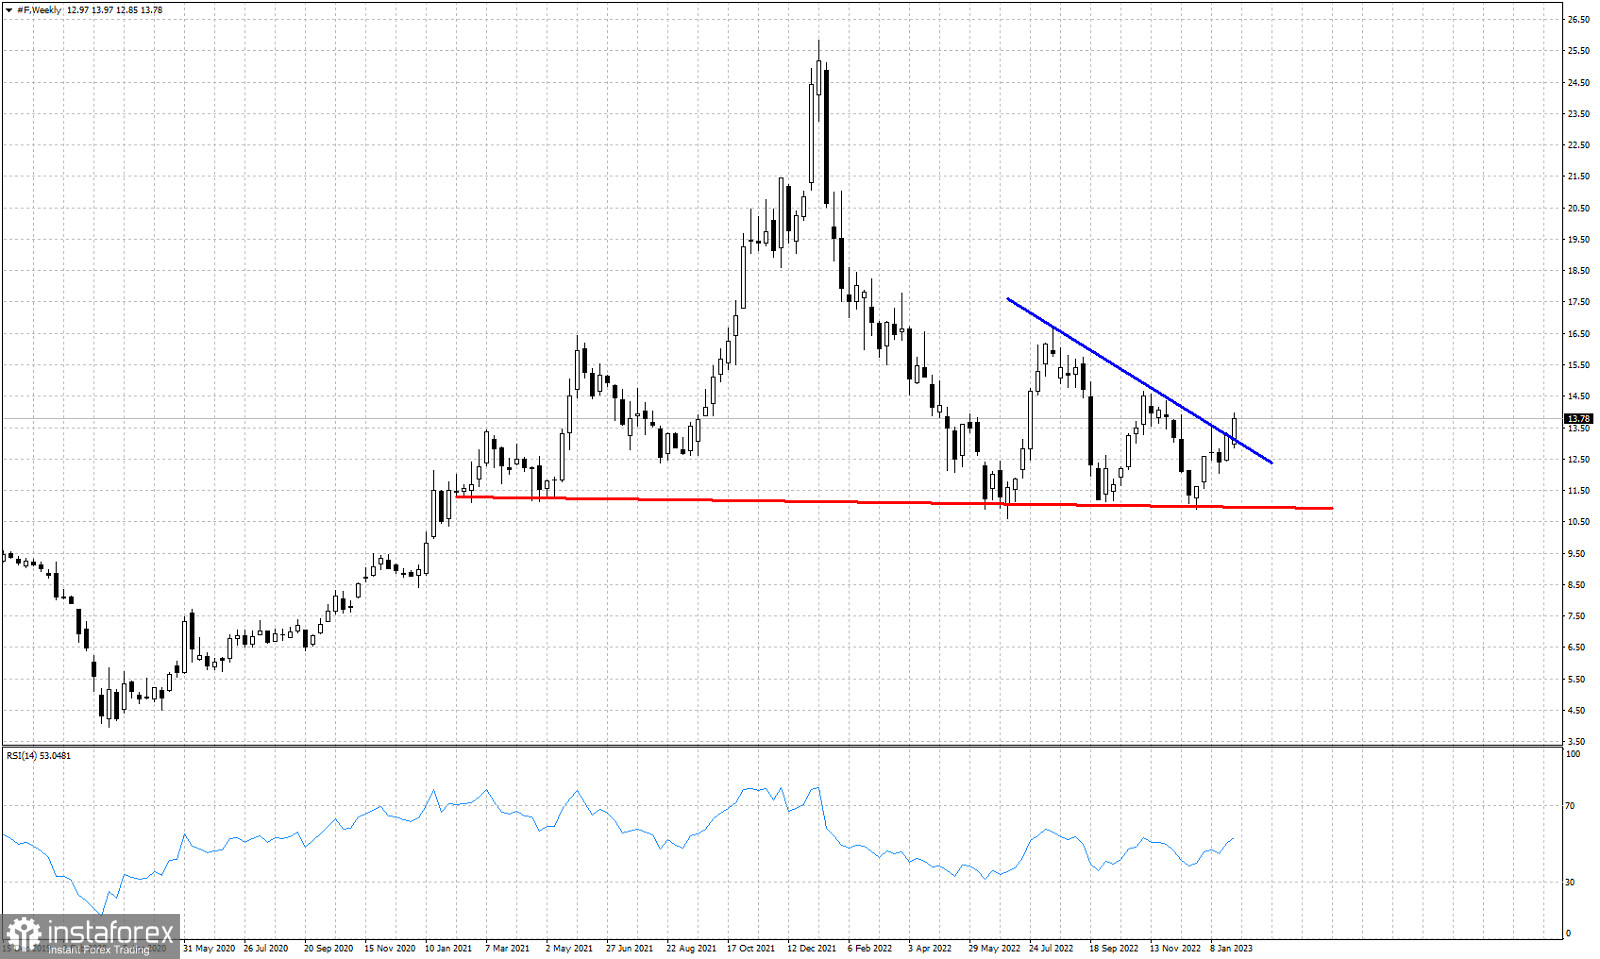
Red line- support neckline
Blue line- trend line resistance
After respecting key support around $11 and bouncing towards our short-term target at $13.50, Ford stock price has now managed on a weekly basis to break above the blue downward sloping resistance trend line. Having respected the horizontal support at $11 combined with a break above $13.50, we have a sign of strength and reversal after more than a year under pressure. Next important resistance is the previous high at $14.65. A break above this level will also cancel the Head and Shoulders bearish pattern.
*यहां पर लिखा गया बाजार विश्लेषण आपकी जागरूकता बढ़ाने के लिए किया है, लेकिन व्यापार करने के लिए निर्देश देने के लिए नहीं |
InstaSpot analytical reviews will make you fully aware of market trends! Being an InstaSpot client, you are provided with a large number of free services for efficient trading.


