



¡Nuestro equipo cuenta con más de 7,000,000 operadores!
Cada día, trabajamos juntos para mejorar las operaciones. Obtenemos grandes resultados y seguimos adelante.
El reconocimiento de millones de operadores en todo el mundo es el mejor agradecimiento a nuestro trabajo! ¡Usted hizo su elección y haremos todo lo que esté a nuestro alcance para satisfacer sus expectativas!
¡Juntos somos un gran equipo!
InstaSpot. ¡Orgulloso de trabajar para usted!



¡Actor, 6 veces ganador del torneo UFC y un verdadero héroe!
El hombre que se hizo a sí mismo. El hombre que sigue nuestro camino.
El secreto detrás del éxito de Taktarov es el constante movimiento hacia el objetivo.
¡Revele todo los lados de su talento!
Descubra, intente, fracase, ¡pero nunca se rinda!
InstaSpot. ¡Su historia de éxito comienza aquí!
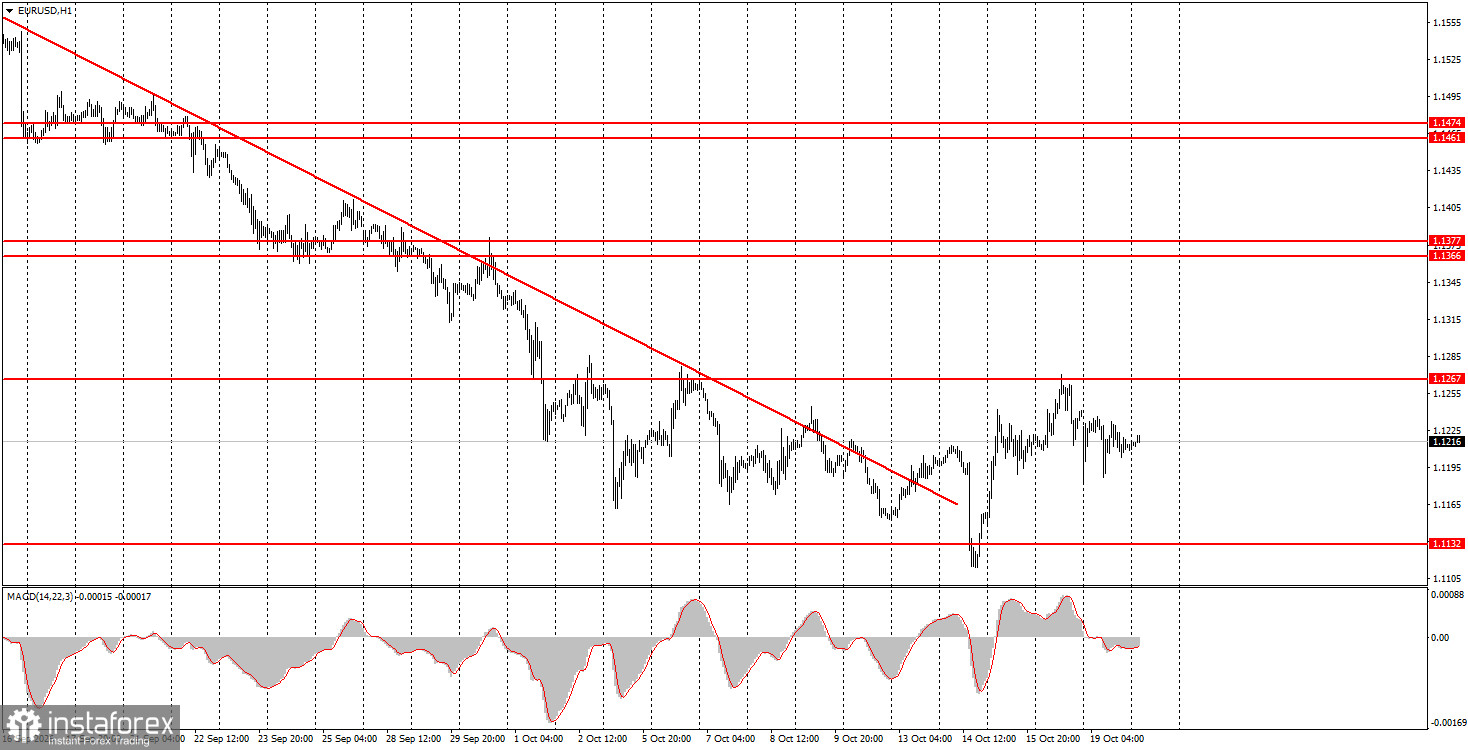
EUR/USD showed no meaningful moves on Monday, as expected. At the open, price dropped sharply, then recovered just as sharply, and that was essentially the extent of the action. Note that by day's end the euro had only retraced a few dozen pips — market noise rather than a genuine reaction to events in France. Mass unrest and riots are, of course, negative, but protests occur regularly in many countries, including the US. That alone isn't enough for a currency to lose hundreds of pips. As for broader budget and debt concerns across the eurozone, the US faces similar fiscal strains—and with presidential elections in two weeks, political outcomes remain uncertain there as well.
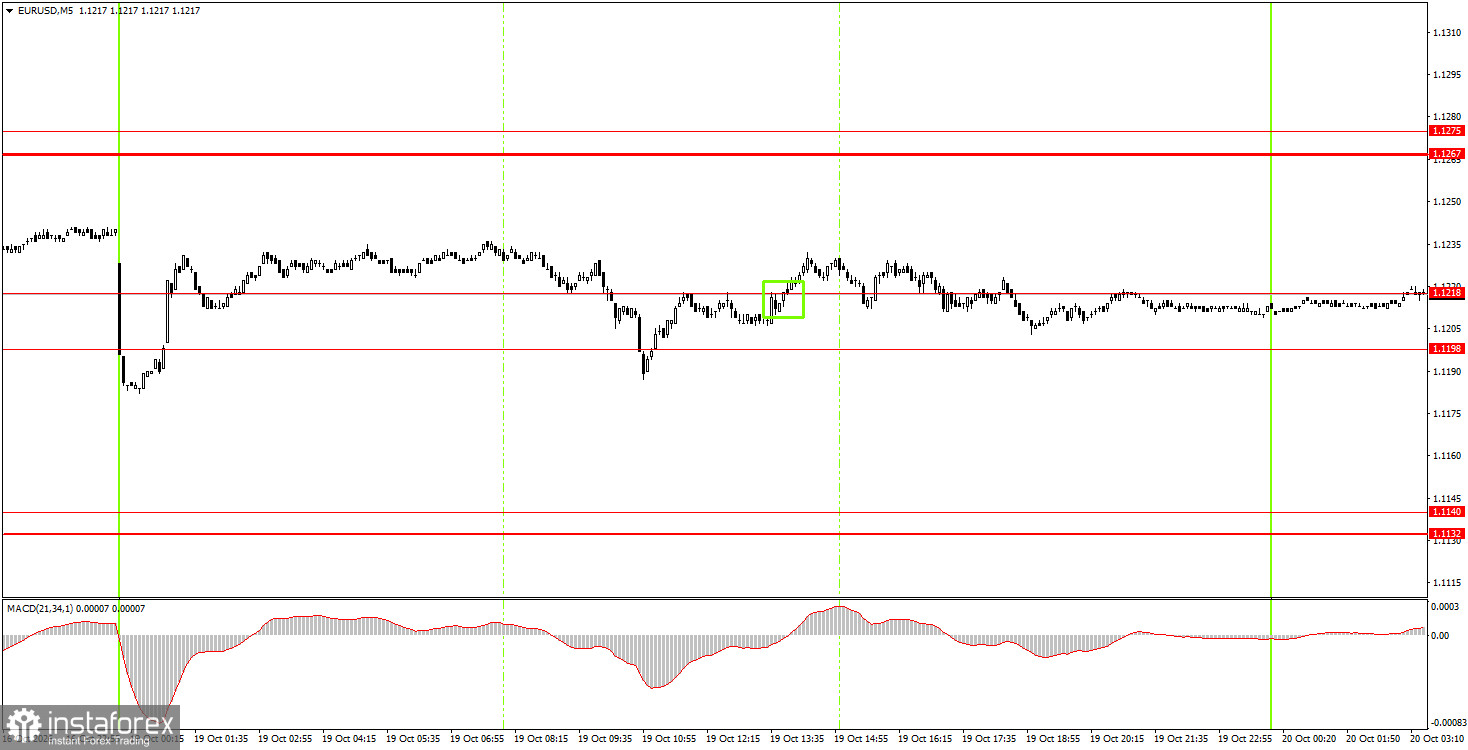
On the 5-minute timeframe, Monday produced just one trading signal while price traded mostly sideways. During the European session, the pair closed above the 1.1198–1.1218 area, offering opportunities for entering long positions. By the end of the day, price had neither extended higher nor invalidated the buy signal, so that setup may still be in play today.
On the hourly timeframe, EUR/USD still reflects a downtrend that has been a full trend, but there are grounds to think that trend may be over. Over the past few months, we do not believe the euro should have collapsed like a stone for an entire month. The dollar now looks heavily overbought, and many euro-positive factors have been ignored.
On Tuesday, novice traders may consider short positions if price closes below the 1.1198–1.1218 area, targeting 1.1132–1.1140. Open long positions on a rebound from the 1.1198–1.1218 area, targeting 1.1267–1.1275.
On the 5-minute timeframe watch these levels: 1.1011, 1.1088, 1.1132–1.1140, 1.1198–1.1218, 1.1267–1.1275, 1.1366–1.1377, 1.1461–1.1474, 1.1527–1.1531, 1.1584–1.1594, 1.1655–1.1665. On Tuesday, the eurozone will publish economic-sentiment indices, and the US will release housing starts and building permits. We regard these releases as secondary and do not expect strong market reactions.
Price levels (areas) of support and resistance serve as targets for opening buy or sell trades or as sources of signals.
Red lines indicate channels or trend lines that show the current trend and the preferred trading direction.
The MACD indicator (14,22,3) — the histogram and signal line — is an auxiliary indicator that can also provide signals.
Important speeches and reports (listed in the news calendar) can significantly influence currency pair movements. Therefore, during their release, traders should approach trading with utmost caution, or exit the market to avoid sudden reversals against the preceding move.
Beginner forex traders should remember that not every trade can be profitable. Developing a clear strategy and practicing money management are key to long-term success in trading.
*El análisis de mercado publicado aquí tiene la finalidad de incrementar su conocimiento, más no darle instrucciones para realizar una operación.
¡Los informes analíticos de InstaSpot lo mantendrá bien informado de las tendencias del mercado! Al ser un cliente de InstaSpot, se le proporciona una gran cantidad de servicios gratuitos para una operación eficiente.


