




¡Nuestro equipo cuenta con más de 7,000,000 operadores!
Cada día, trabajamos juntos para mejorar las operaciones. Obtenemos grandes resultados y seguimos adelante.
El reconocimiento de millones de operadores en todo el mundo es el mejor agradecimiento a nuestro trabajo! ¡Usted hizo su elección y haremos todo lo que esté a nuestro alcance para satisfacer sus expectativas!
¡Juntos somos un gran equipo!
InstaSpot. ¡Orgulloso de trabajar para usted!





¡Actor, 6 veces ganador del torneo UFC y un verdadero héroe!
El hombre que se hizo a sí mismo. El hombre que sigue nuestro camino.
El secreto detrás del éxito de Taktarov es el constante movimiento hacia el objetivo.
¡Revele todo los lados de su talento!
Descubra, intente, fracase, ¡pero nunca se rinda!
InstaSpot. ¡Su historia de éxito comienza aquí!
Another attempt by Bitcoin to rise above $84,000 appears to be turning into a sell-off. So, these moves and attempts to buy the dip will, with high probability, end in a deeper failure, and the current rebound should be treated cautiously. Price recovered after the morning crash, but bulls have so far failed to hold above $84,000.

The picture inside the range is ambiguous. Bitcoin does indeed sit closer to the upper boundary of the $80,000–$87,000 range and, unlike the August sell-off, has not repeated a similar fall. Back then, Bitcoin's relative strength was explained by expectations of easier central bank policy. Now the picture is reversed: after the September Fed hike to 3.75–4.00%, the market is discussing the next increase, so the previous support has weakened and the market is resting on something else.
The main weak point is demand. Spot Bitcoin ETFs have lost $451m since the start of October, including $69m on Monday, and last week three fund categories lost about $1.25bn. That means the rebound is occurring without institutional money inflows.
Now about the market structure. Many traders already note that bulls struggle to stay above $84,000 on lower timeframes. Order books show a dense layer of sell orders at that level, and for upside to continue, this is a wall. To break it requires sizeable spot and ETF demand, which is absent now. If the price again hits this layer, liquidations of long positions—about $586m yesterday—could repeat.
The key events will be US inflation on October 14 and the Fed decision on October 28. My base case: until Bitcoin firmly closes above $84,100 on strong volume, every rebound will be met with selling, and the risk of a return to $81,000 remains high. Weak inflation may briefly ease pressure, but a strong print combined with high oil prices and yields at multi-year highs will turn a cautious market into a selling one. Therefore, it is wiser to refrain from aggressive dip buying until the data are out.
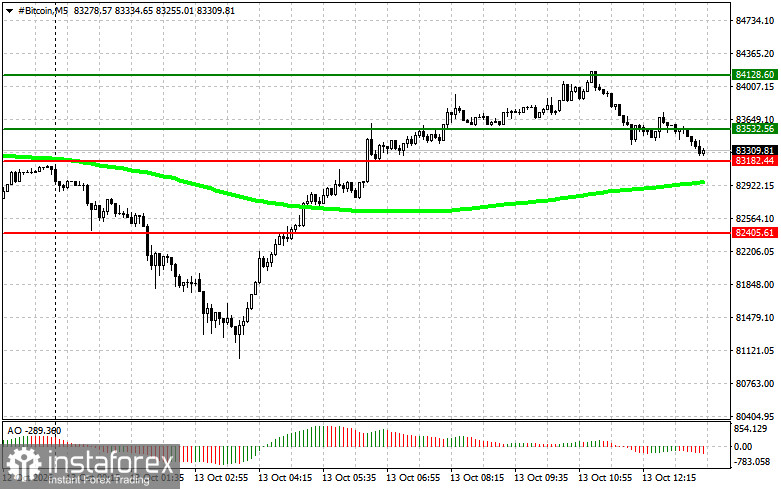
As for BTC, the price is trading in a narrow corridor between support at $83,100 and resistance at $83,500, with outer boundaries at $82,400 and $84,100, and the plan is built around two mirror directions with full breakout and rejection scenarios. For long orders, there are two entries. First, a break above $83,500 with confirmation: buy targeting $84,100, where I take profit and consider shorting the retracement, provided the price stays above the 50-day moving average and the Awesome indicator is above zero. Second, a bounce from $83,100 if a downside break fails and the drop proves false: buy for a return first to $83,500 and then $84,100. Sell opportunities are symmetric. A confirmed break below $83,100 gives a short target of $82,400, but only when the moving average lies above the price and Awesome is below zero. If the break above $83,500 fails and the price returns below that level, a short from resistance targets a return to $83,100 and then $82,400.
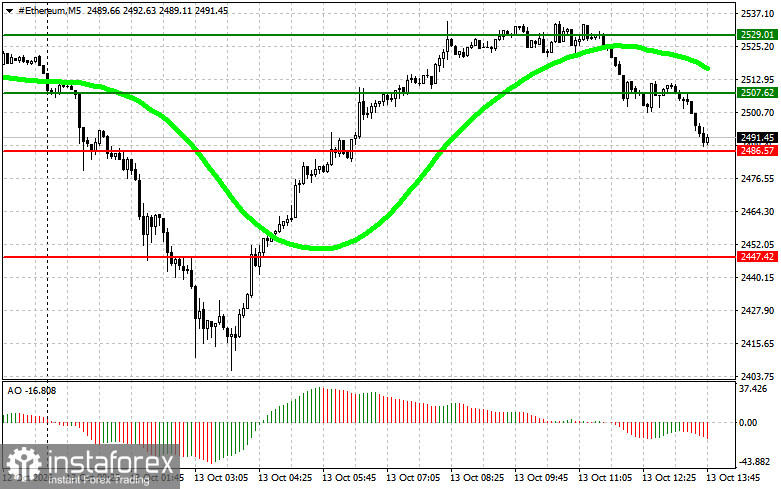
Regarding Ether, the logic mirrors Bitcoin on its own price scale: an inner corridor between support at $2,486 and resistance at $2,507, with outer boundaries at $2,447 and $2,529. Buy on a break above $2,507 targeting $2,529, where profit is taken and a short on the pullback may be considered; the condition is the same—price above the 50-day moving average and Awesome above zero. Buy on a rebound from $2,486 if a downside break fails, with initial targets of $2,507 then $2,529.
For sell orders, a confirmed break below $2,486 opens a short toward $2,447 provided the moving average is above price and Awesome is below zero. A rejection from $2,507 after a failed upside breakout gives a short back to $2,486 and then $2,447. Both indicators remain filters to cut false moves, not standalone entry signals, so decisions are made only after real price confirmation of the designated levels.
*El análisis de mercado publicado aquí tiene la finalidad de incrementar su conocimiento, más no darle instrucciones para realizar una operación.
¡Los informes analíticos de InstaSpot lo mantendrá bien informado de las tendencias del mercado! Al ser un cliente de InstaSpot, se le proporciona una gran cantidad de servicios gratuitos para una operación eficiente.


