




¡Nuestro equipo cuenta con más de 7,000,000 operadores!
Cada día, trabajamos juntos para mejorar las operaciones. Obtenemos grandes resultados y seguimos adelante.
El reconocimiento de millones de operadores en todo el mundo es el mejor agradecimiento a nuestro trabajo! ¡Usted hizo su elección y haremos todo lo que esté a nuestro alcance para satisfacer sus expectativas!
¡Juntos somos un gran equipo!
InstaSpot. ¡Orgulloso de trabajar para usted!





¡Actor, 6 veces ganador del torneo UFC y un verdadero héroe!
El hombre que se hizo a sí mismo. El hombre que sigue nuestro camino.
El secreto detrás del éxito de Taktarov es el constante movimiento hacia el objetivo.
¡Revele todo los lados de su talento!
Descubra, intente, fracase, ¡pero nunca se rinda!
InstaSpot. ¡Su historia de éxito comienza aquí!
The wave pattern on the 4-hour chart for EUR/USD has changed. There is still no indication that the upward trend segment (lower chart), which began in January of last year, has been canceled. However, the trend structure has now taken on a corrective form. From a long-term perspective, wave C may develop, with its low expected to form below the low of wave A. At the moment, it is difficult to believe in such a strong decline of the euro, but the first quarter of 2026 demonstrated that geopolitics can dramatically alter trends.
On the lower timeframe, I can identify a classic three-wave upward corrective structure. After this structure was completed, the market began forming a new downward trend segment, which logically should be impulsive. If this assumption is correct, we should expect the formation of a five-wave structure within wave C of the higher degree, with targets below the 1.1400 level. Are there any fundamental reasons to expect such strong strengthening of the dollar? In my opinion, not at the moment. Last week showed that Tehran and Washington continue negotiations, which could theoretically end successfully. As long as these chances remain, it will be difficult for the dollar to continue strengthening.
The EUR/USD pair gained several dozen basis points during Wednesday, although this movement may not be related to market optimism regarding geopolitics. Recently, the news background has been changing constantly, sometimes several times a day. Traders have already become accustomed to interpreting gains in the euro as a sign of progress in negotiations and constructive statements from one of the parties, while gains in the dollar signal another "exchange of hostilities," ceasefire violations, aggressive rhetoric, or threats. However, nothing of the sort occurred today.
Moreover, on Tuesday, the deal between Iran and the United States once again appeared to be at risk after another armed incident took place in the Strait of Hormuz involving Iranian and U.S. forces. More specifically, the U.S. Navy launched strikes against Iranian missile launchers and boats, but no response has followed so far.
At the same time, it became known that Iran still does not intend to abandon its enriched uranium stockpile or halt uranium enrichment in the future. At least one representative of the Iranian government stated exactly this. This immediately recalls reports from several days ago claiming that Tehran was willing to transfer its enriched uranium reserves abroad, but only if China became the storage country. As we can see, contradictory information is now emerging even from Iran itself, while the sources of such information often remain unidentified. As a result, virtually any media outlet can publish any claim, since it is impossible to verify it.
The rise in demand for the euro on Wednesday may simply be linked to the formation of a corrective wave. Therefore, I would not attach too much significance to this movement.
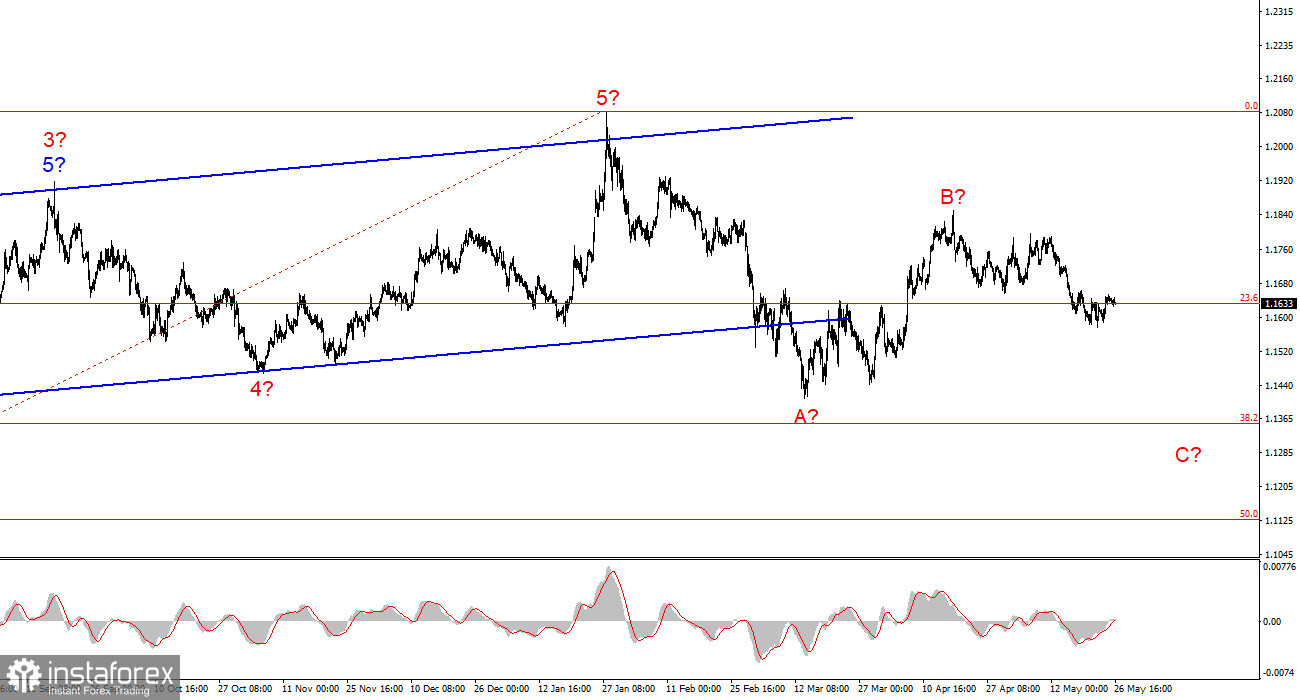
Based on the EUR/USD analysis, I conclude that the pair remains within an upward trend segment (lower chart), while in the shorter term it remains within a corrective structure. The corrective a-b-c wave formation appears complete. Consequently, wave 3 or c is currently developing, which may become part of a larger wave C. The entire wave C (if the current wave count is correct) may complete far below the 1.1400 level. However, such a scenario would require strong geopolitical support. Otherwise, the downward wave structure could take the form of an a-b-c correction and finish near the 1.1578 level.
On the higher timeframe, an upward trend segment remains visible, after which a corrective wave structure begins to form. In the near future, wave C is expected to develop with targets near 1.1352, which corresponds to the 38.2% Fibonacci retracement level. After the completion of the A-B-C structure, a new long-term upward trend may begin.
*El análisis de mercado publicado aquí tiene la finalidad de incrementar su conocimiento, más no darle instrucciones para realizar una operación.
¡Los informes analíticos de InstaSpot lo mantendrá bien informado de las tendencias del mercado! Al ser un cliente de InstaSpot, se le proporciona una gran cantidad de servicios gratuitos para una operación eficiente.


