


¡Nuestro equipo cuenta con más de 7,000,000 operadores!
Cada día, trabajamos juntos para mejorar las operaciones. Obtenemos grandes resultados y seguimos adelante.
El reconocimiento de millones de operadores en todo el mundo es el mejor agradecimiento a nuestro trabajo! ¡Usted hizo su elección y haremos todo lo que esté a nuestro alcance para satisfacer sus expectativas!
¡Juntos somos un gran equipo!
InstaSpot. ¡Orgulloso de trabajar para usted!


¡Actor, 6 veces ganador del torneo UFC y un verdadero héroe!
El hombre que se hizo a sí mismo. El hombre que sigue nuestro camino.
El secreto detrás del éxito de Taktarov es el constante movimiento hacia el objetivo.
¡Revele todo los lados de su talento!
Descubra, intente, fracase, ¡pero nunca se rinda!
InstaSpot. ¡Su historia de éxito comienza aquí!
The wave pattern on the 4-hour EUR/USD chart has changed. There is still no question of cancelling the upward trend segment (lower chart) that began in January last year; however, the wave structure of the trend has now taken on a corrective form. In the long term, a wave C may develop, with its low expected to be below the low of wave A. At the moment, such a strong decline in the euro is difficult to believe, but the first quarter of 2026 has shown that geopolitics can work wonders and reverse trends.
On the lower timeframe, I can identify a classic three-wave corrective upward structure. After this structure was completed, a new downward trend segment began, which by logic should be impulsive. If this assumption is correct, we should expect the formation of a five-wave structure within wave C of a higher degree, with targets below the 1.1400 level. Are there information grounds to expect such a strong strengthening of the dollar? In my view—no. Monday already showed that Tehran and Washington may return to the negotiating table, which makes further dollar strength unlikely.
The EUR/USD pair rose by 30 basis points during Monday's session, which is, of course, very little. However, compared to the previous week, it is something. On Monday, information emerged that Iran and the US exchanged new lists of demands to resume negotiations. Washington softened its position regarding Iranian oil, referring to a temporary suspension of sanctions. At the moment, it is unclear how exactly this concession will be implemented, as Tehran currently has no ability to export oil due to the blockade of the Strait of Hormuz and Iranian ports by the US Navy.
However, if the information is accurate, I believe the US blockade will be lifted during negotiations. The fact that Donald Trump was the first to make concessions best confirms my earlier conclusions. First: Trump is not inclined toward resuming war. Second: he does not want war due to upcoming elections and public dissatisfaction with fuel prices. Third: Trump's words and actions often differ significantly.
For financial, energy, and currency markets, this is positive. Trump may once again verbally threaten Iran, but as noted earlier, Tehran has almost fully restored its military capabilities after the February–March conflict. Iran retains its nuclear status, and the blockade of the Strait of Hormuz and high oil prices are now harming the United States itself. Therefore, both sides—Iran and the US—need to find a way out of this standoff. If this week proves geopolitically positive, the development of a downward trend segment will be in question. In that case, we may see the completion of a three-wave corrective structure.
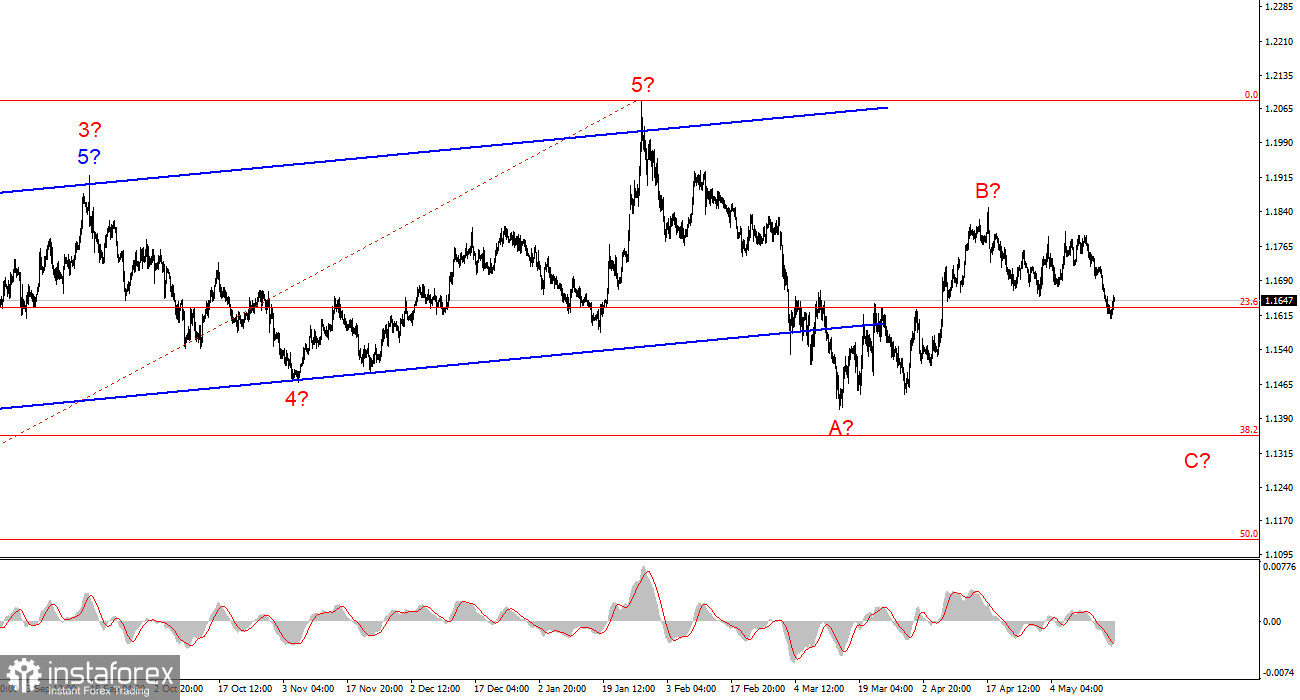
Based on the EUR/USD analysis, I conclude that the instrument remains within an upward trend structure (lower chart), and in the shorter term within a corrective structure. The a-b-c corrective wave sequence appears to be completed. Therefore, wave 3 or wave C is currently developing, which may be part of a larger wave C. The full wave C (if the wave count is correct) may be much lower than the 1.1400 level. However, such a scenario would require strong geopolitical support. Otherwise, the a-b-c correction may already be close to completion.
On the higher timeframe, an upward trend segment is visible, after which a corrective wave structure begins forming. In the near term, wave C is expected to develop with targets around 1.1352, corresponding to the 38.2% Fibonacci level. After the completion of the A-B-C structure, a new long-term bullish trend may begin.
Key Principles of My Analysis
*El análisis de mercado publicado aquí tiene la finalidad de incrementar su conocimiento, más no darle instrucciones para realizar una operación.
¡Los informes analíticos de InstaSpot lo mantendrá bien informado de las tendencias del mercado! Al ser un cliente de InstaSpot, se le proporciona una gran cantidad de servicios gratuitos para una operación eficiente.


