


¡Nuestro equipo cuenta con más de 7,000,000 operadores!
Cada día, trabajamos juntos para mejorar las operaciones. Obtenemos grandes resultados y seguimos adelante.
El reconocimiento de millones de operadores en todo el mundo es el mejor agradecimiento a nuestro trabajo! ¡Usted hizo su elección y haremos todo lo que esté a nuestro alcance para satisfacer sus expectativas!
¡Juntos somos un gran equipo!
InstaSpot. ¡Orgulloso de trabajar para usted!


¡Actor, 6 veces ganador del torneo UFC y un verdadero héroe!
El hombre que se hizo a sí mismo. El hombre que sigue nuestro camino.
El secreto detrás del éxito de Taktarov es el constante movimiento hacia el objetivo.
¡Revele todo los lados de su talento!
Descubra, intente, fracase, ¡pero nunca se rinda!
InstaSpot. ¡Su historia de éxito comienza aquí!
The GBP/USD currency pair attempted another downward correction on Wednesday, but it has actually been trading in a sideways channel between 1.3480 and 1.3588 for a week. The area between 1.3465 and 1.3480 could not be overcome again, so the flat trend will persist for a while longer. Yesterday, a fairly important inflation report was published in the UK, but its significance proved rather bland. Notably, the core inflation decreased from 3.2% to 3.1%, which was unexpected for traders. Headline inflation rose from 3% to 3.3%, as anticipated. Since experts had almost predicted the actual figures for March, the market's reaction was nearly non-existent. In addition, traders continue to ignore any macroeconomic data. Geopolitics, although it now has much less influence on the pair's movement, remains in focus. Currently (as in the last two months), everyone is awaiting news from the Middle East.
From a technical perspective, the British currency is set for a downward correction but is still trading sideways. If the price consolidates below the 1.3465-1.3480 area, the decline will continue toward the Senkou Span B line. Below the Senkou Span B line, we allow for a decline only if negotiations between the US and Iran ultimately fail and war resumes.
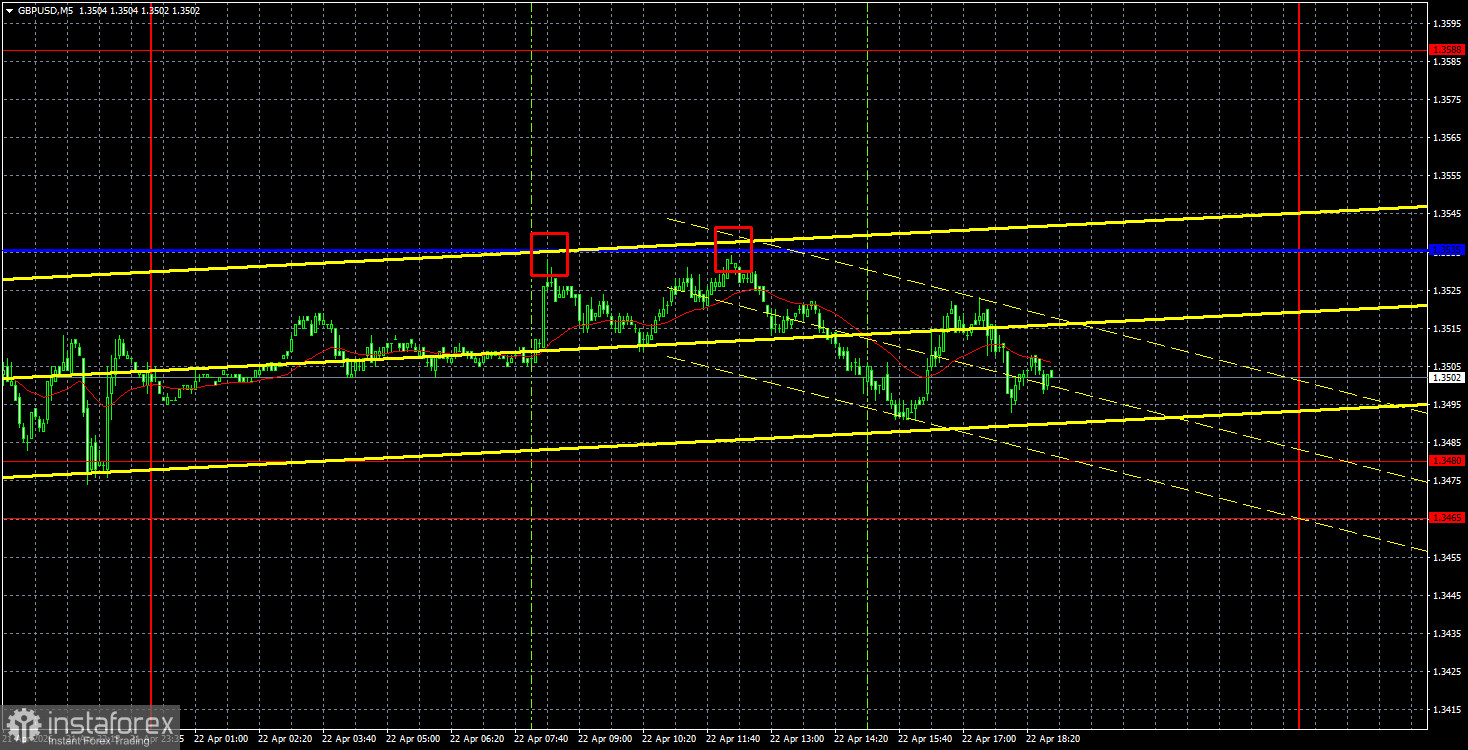
On the 5-minute timeframe, two excellent signals were formed yesterday. During the European trading session, the price touched the critical line twice and bounced off it, resulting in two sell signals. In the first case, the pound's decline was very weak, while in the second case, it amounted to about 25 pips. Yes, volatility remains low, as expected for a flat market.
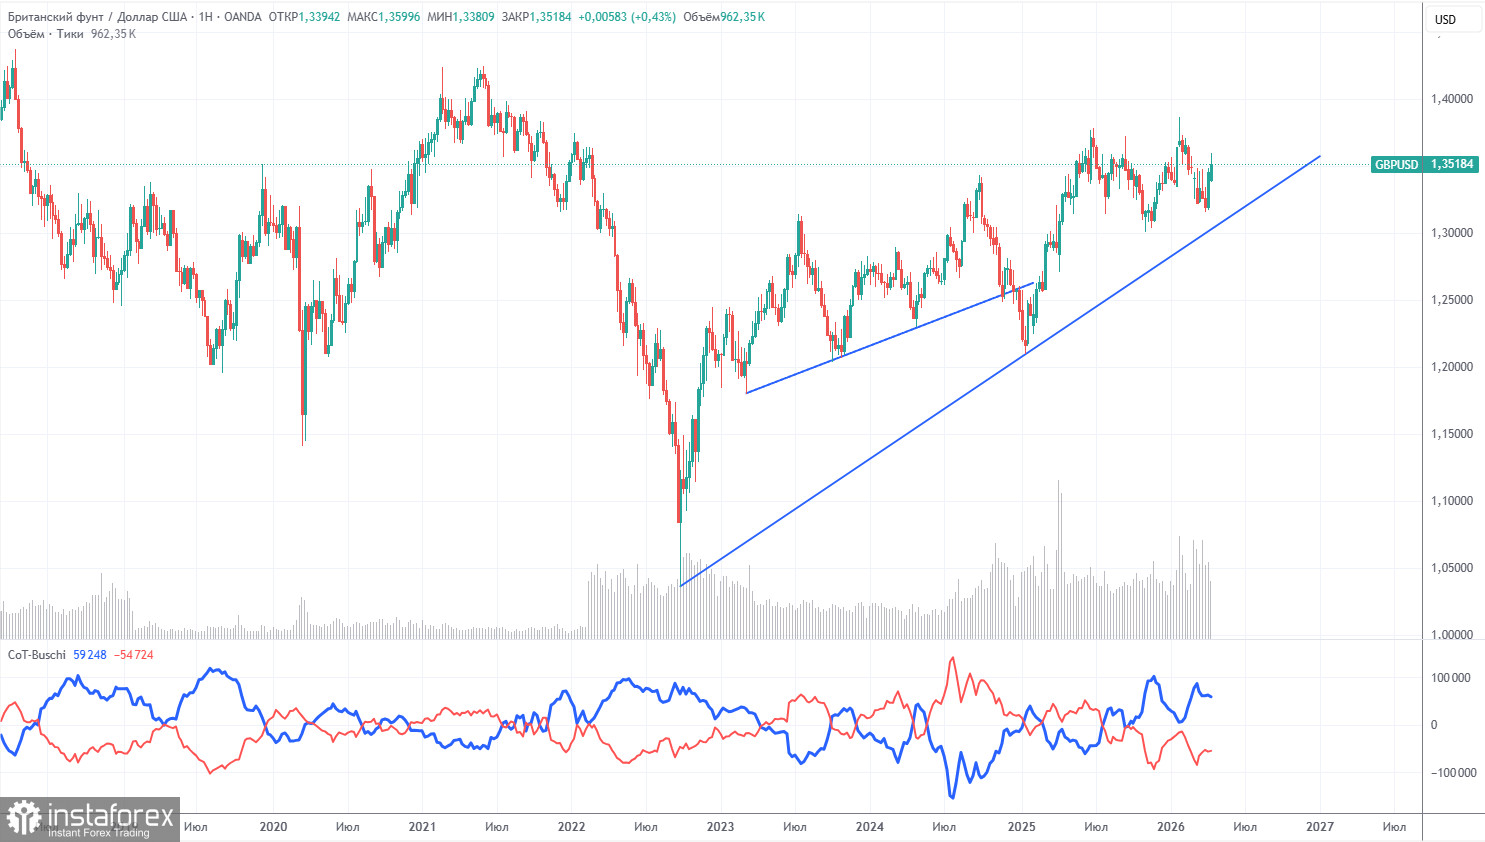
COT reports on the British pound show that commercial traders' sentiment has been changing steadily in recent years. The red and blue lines, which represent the net positions of commercial and non-commercial traders, frequently intersect and are mostly close to zero. Currently, the lines are moving farther apart, with non-commercial traders still dominating with their sales. However, considering the events in the Middle East, it is no longer surprising that demand for risk currencies is falling while demand for the dollar is rising.
In the long term, the dollar continues to decline due to Trump's policies, as shown on the weekly timeframe (illustration above). The trade war will continue in one form or another for a long time, and Trump's policies are aimed directly and indirectly at weakening the American currency. However, geopolitical factors are currently the top priority, providing significant support to the dollar. According to the latest COT report (from April 14), the "Non-commercial" group opened 7,600 BUY contracts and 5,900 SELL contracts. Thus, the net position of non-commercial traders increased by 1,700 contracts over the week.
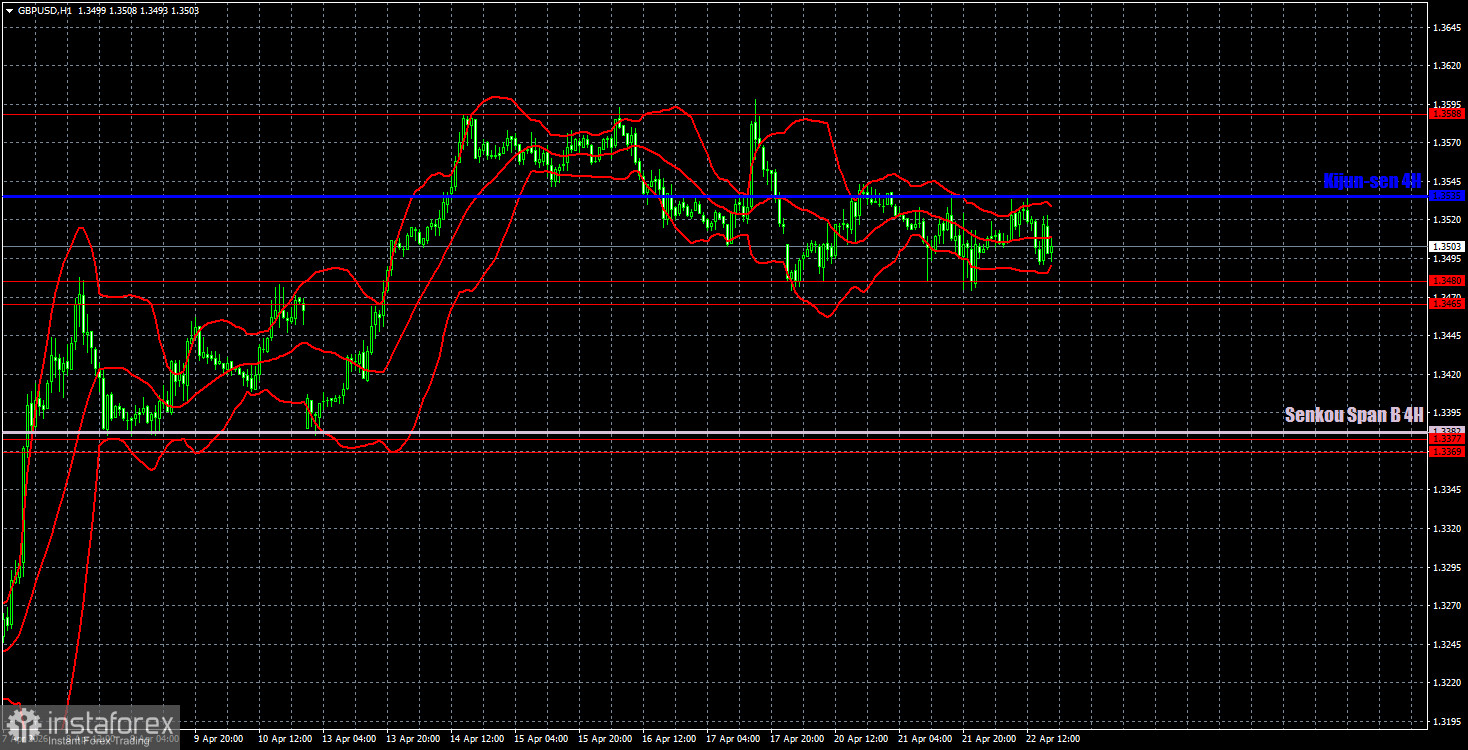
On the hourly timeframe, the GBP/USD pair continues to form an upward trend, which may be canceled if a full-scale war resumes in the Middle East. It should also be noted that the influence of geopolitics is weakening, as evidenced by movements this week, but military actions in the region remain on pause. The Strait of Hormuz remains blocked, and there is no progress in negotiations. A correction is brewing.
For April 23, we highlight the following important levels: 1.3096-1.3115, 1.3179-1.3187, 1.3369-1.3377, 1.3465-1.3480, 1.3588, 1.3671-1.3681, 1.3751-1.3763. The Senkou Span B line (1.3382) and Kijun-sen line (1.3535) may also be sources of signals. It is recommended to set a Stop Loss at breakeven when the price moves 20 pips in the correct direction. The Ichimoku indicator lines may move throughout the day, which should be taken into account when determining trading signals.
On Thursday, indices of business activity in the services and manufacturing sectors are scheduled for publication in the UK and the US, and are unlikely to interest traders more than the British reports on inflation and unemployment. Most likely, the pair will remain within the sideways channel. The market will again be awaiting geopolitical news.
Today, traders may consider short positions with a target of 1.3369-1.3377 if the price consolidates below the 1.3465-1.3480 area. Long positions can be opened with targets of 1.3535 and 1.3588 if the price bounces off the 1.3465-1.3480 area.
Price levels of support and resistance – thick red lines, around which the movement may end. They are not sources of trading signals.
Kijun-sen and Senkou Span B lines – lines of the Ichimoku indicator that are carried over to the hourly timeframe from the 4-hour one. They are strong lines.
Extreme levels – thin red lines from which the price has previously bounced. They are sources of trading signals.
Yellow lines – trend lines, trend channels, and any other technical patterns.
Indicator 1 on COT charts – the size of the net position of each category of traders.
*El análisis de mercado publicado aquí tiene la finalidad de incrementar su conocimiento, más no darle instrucciones para realizar una operación.
¡Los informes analíticos de InstaSpot lo mantendrá bien informado de las tendencias del mercado! Al ser un cliente de InstaSpot, se le proporciona una gran cantidad de servicios gratuitos para una operación eficiente.


