


¡Nuestro equipo cuenta con más de 7,000,000 operadores!
Cada día, trabajamos juntos para mejorar las operaciones. Obtenemos grandes resultados y seguimos adelante.
El reconocimiento de millones de operadores en todo el mundo es el mejor agradecimiento a nuestro trabajo! ¡Usted hizo su elección y haremos todo lo que esté a nuestro alcance para satisfacer sus expectativas!
¡Juntos somos un gran equipo!
InstaSpot. ¡Orgulloso de trabajar para usted!


¡Actor, 6 veces ganador del torneo UFC y un verdadero héroe!
El hombre que se hizo a sí mismo. El hombre que sigue nuestro camino.
El secreto detrás del éxito de Taktarov es el constante movimiento hacia el objetivo.
¡Revele todo los lados de su talento!
Descubra, intente, fracase, ¡pero nunca se rinda!
InstaSpot. ¡Su historia de éxito comienza aquí!
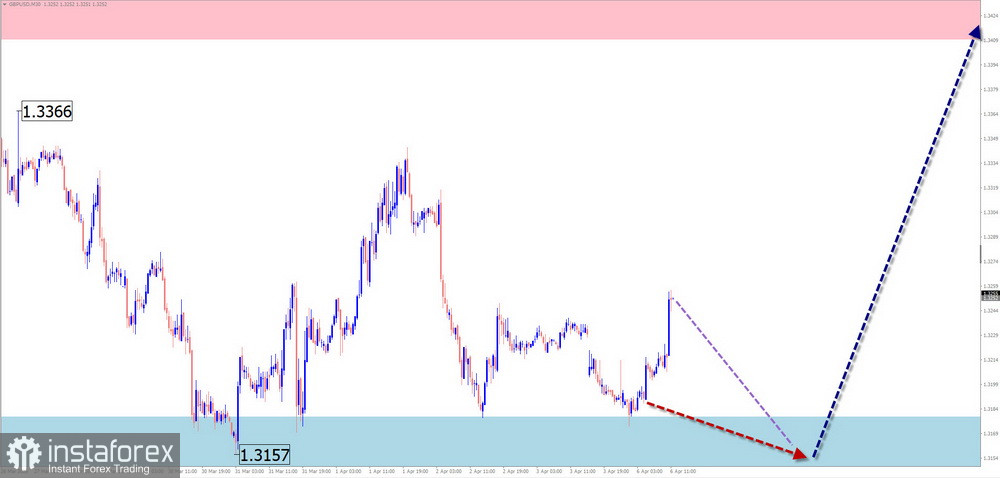
GBP/USD
Analysis: Since January of this year, price movement in the main British pound pair has been driven by a downward wave algorithm. After touching the upper boundary of a strong potential reversal zone, quotes entered a drifting phase, forming a full correction.
Forecast: In the first half of the week, sideways movement along resistance is expected. Closer to the weekend, the downward movement of the pound may resume, likely accompanied by increased volatility after major economic news releases.
Potential reversal zones
Resistance:
Support:
Recommendations:Selling: No favorable conditions expected for such trades this week.Buying: Relevant after confirmed reversal signals appear near the support zone.
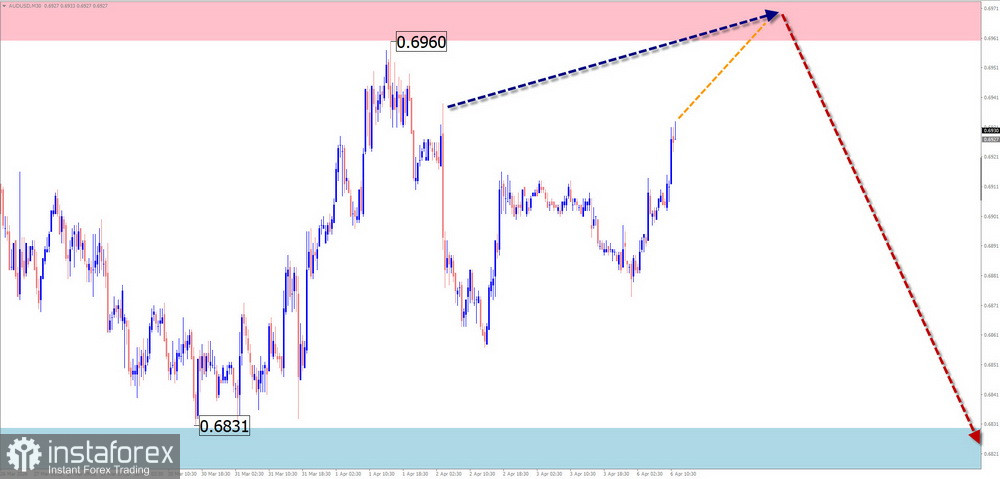
AUD/USD
Analysis: Since December last year, the Australian dollar against the US dollar has been forming a bearish wave. Its middle part (B) was completed last week. At the end of the week, quotes began forming the final part, breaking through intermediate support. At the time of analysis, price is pulling back to this zone to consolidate.
Forecast: In the coming days, sideways movement with an upward bias is expected. After possible pressure on resistance, a reversal and decline toward the support zone may follow.
Potential reversal zones
Resistance:
Support:
Recommendations:Buying: Quite risky and may lead to losses.Selling: Possible after confirmed reversal signals near resistance.
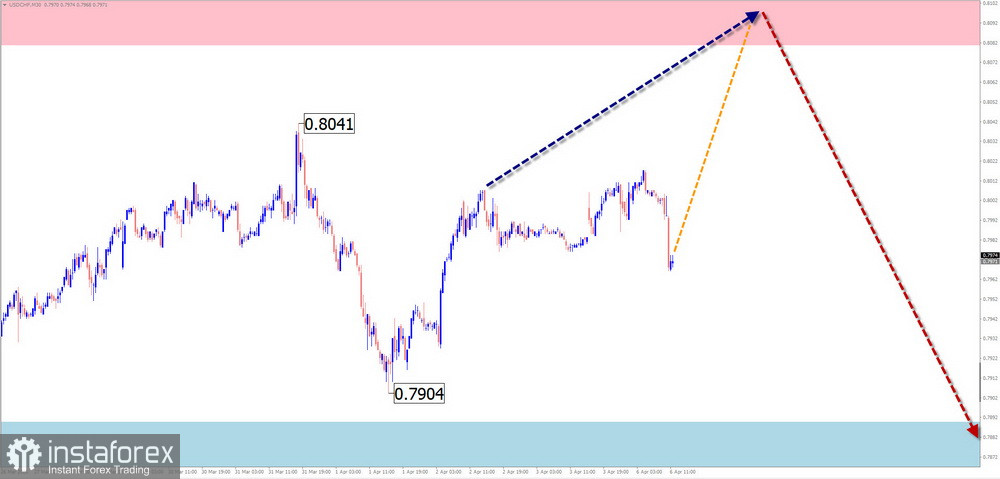
USD/CHF
Analysis: On the daily chart, an upward wave has been forming since April last year. The final segment (C) began at the end of January. Price is approaching the lower boundary of a strong potential reversal zone on the daily timeframe. The wave structure is still incomplete.
Forecast: In the next couple of days, sideways drifting toward resistance is expected. After that, conditions for a reversal may form. A decline may resume closer to the weekend. A spike in volatility and a brief breakout above resistance cannot be ruled out.
Potential reversal zones
Resistance:
Support:
Recommendations:Buying: Can be used with small position sizes for intraday trades.Selling: Relevant after confirmed reversal signals near resistance.
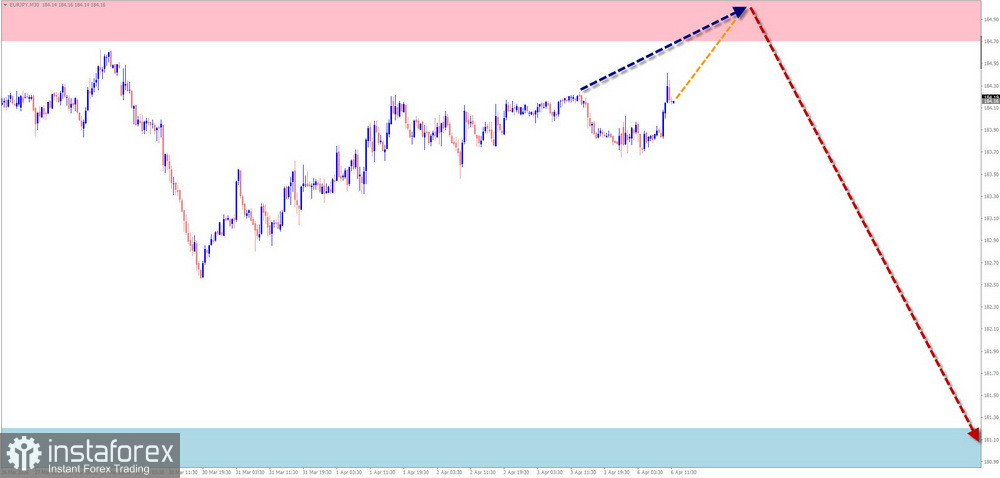
EUR/JPY
Analysis: The short-term chart shows the formation of an upward wave in the form of a horizontal flat. Price is moving within a channel between reversal zones of different wave levels. Over the past two weeks, the beginning of the final part (C) has been forming.
Forecast: In the next few days, sideways movement with a downward bias is expected. In the second half of the week, a reversal and renewed upward movement toward resistance are likely.
Potential reversal zones
Resistance:
Support:
Recommendations:Selling: Limited potential and relatively risky.Buying: Can be considered after confirmed reversal signals near resistance.
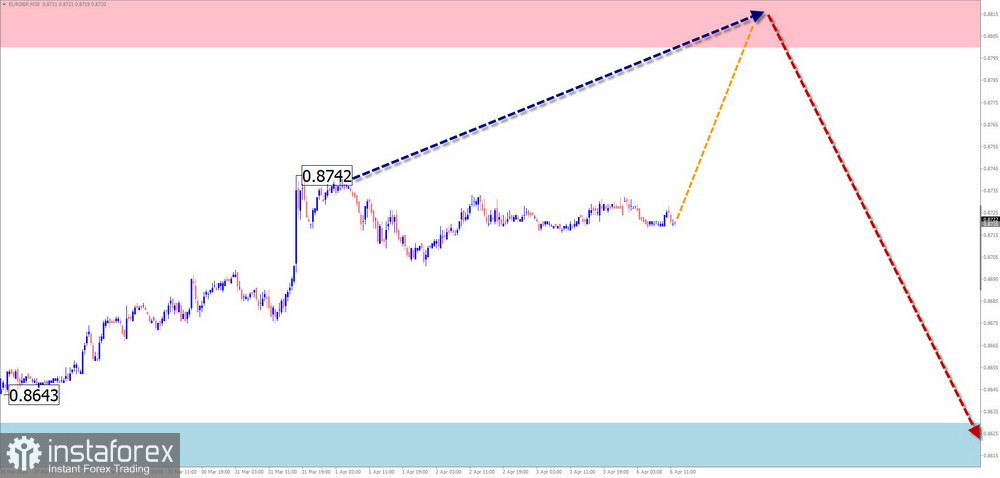
EUR/GBP
Analysis: Since April 11 last year, price movement has been driven by a downward wave. Over the past six months, the chart has been forming an unfinished correction in the shape of a shifting flat. The structure is not yet complete.
Forecast: In the coming days, upward movement is expected to continue until completion near resistance. After testing the upper boundary, a reversal and decline may begin, potentially reaching the lower boundary of the established price channel.
Potential reversal zones
Resistance:
Support:
Recommendations:Buying: Possible with small position sizes during individual sessions.Selling: Relevant after confirmed reversal signals near resistance.
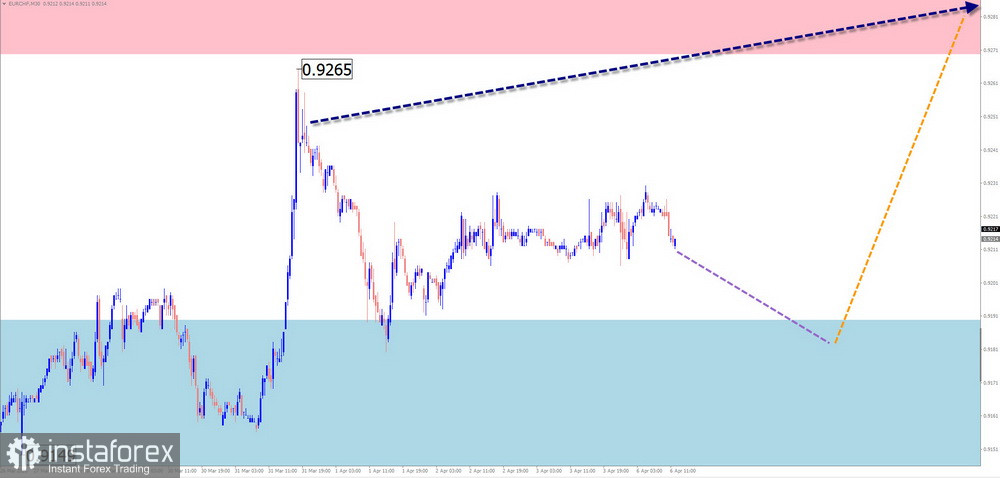
EUR/CHF
Brief Analysis: On the euro/Swiss franc chart, the short-term trend since early March last year has been downward. Since February, a corrective phase (B) has been developing in the form of an extended flat. From the lower boundary of the reversal zone last week, price has started a downward corrective pullback, forming a reversal wave structure.
Weekly Forecast: Next week, sideways movement with an overall upward bias is expected. After a possible pullback to support early in the week, upward movement may resume. Weekly volatility boundaries are defined by opposing calculated zones.
Potential reversal zones
Resistance:
Support:
Recommendations:Buying: Possible with small positions after confirmed reversal signals near support.Selling: Limited potential, high risk.
Notes: In simplified wave analysis (SWA), all waves consist of three parts (A–B–C). The analysis focuses on the latest unfinished wave on each timeframe. Dashed lines indicate expected movements.
Important: Wave analysis does not account for the duration of price movements over time.
*El análisis de mercado publicado aquí tiene la finalidad de incrementar su conocimiento, más no darle instrucciones para realizar una operación.
¡Los informes analíticos de InstaSpot lo mantendrá bien informado de las tendencias del mercado! Al ser un cliente de InstaSpot, se le proporciona una gran cantidad de servicios gratuitos para una operación eficiente.


