


¡Nuestro equipo cuenta con más de 7,000,000 operadores!
Cada día, trabajamos juntos para mejorar las operaciones. Obtenemos grandes resultados y seguimos adelante.
El reconocimiento de millones de operadores en todo el mundo es el mejor agradecimiento a nuestro trabajo! ¡Usted hizo su elección y haremos todo lo que esté a nuestro alcance para satisfacer sus expectativas!
¡Juntos somos un gran equipo!
InstaSpot. ¡Orgulloso de trabajar para usted!


¡Actor, 6 veces ganador del torneo UFC y un verdadero héroe!
El hombre que se hizo a sí mismo. El hombre que sigue nuestro camino.
El secreto detrás del éxito de Taktarov es el constante movimiento hacia el objetivo.
¡Revele todo los lados de su talento!
Descubra, intente, fracase, ¡pero nunca se rinda!
InstaSpot. ¡Su historia de éxito comienza aquí!

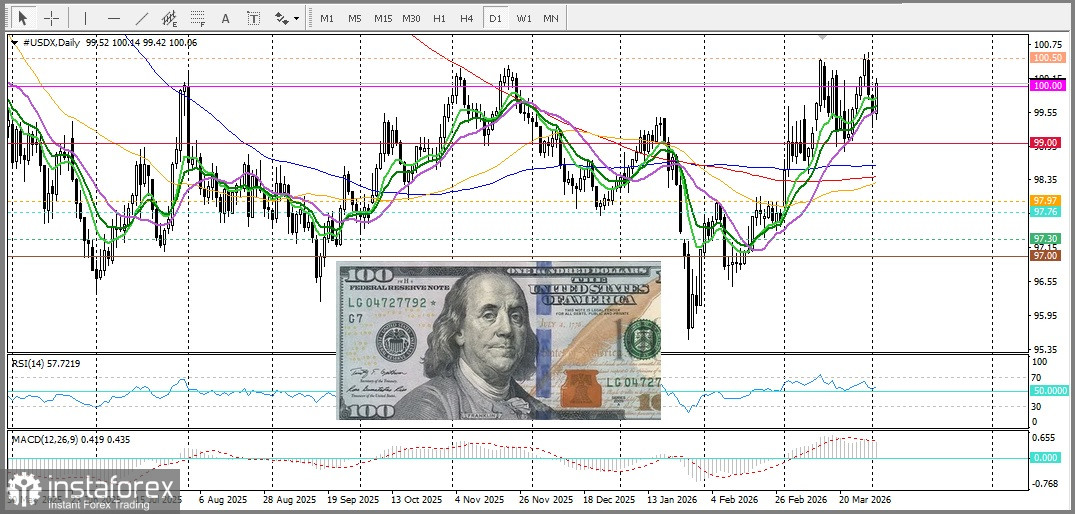
The EUR/USD pair failed to maintain the growth formed over the past two days after reaching a weekly high the day before, and on Thursday faced notable selling pressure. Over the last five hours, spot quotes dropped below the 1.1550 level amid renewed demand for the U.S. dollar, which is traditionally seen as a safe-haven asset. The trigger was a statement by U.S. President Donald Trump about a possible war with Iran, which significantly reduced expectations of de-escalation.
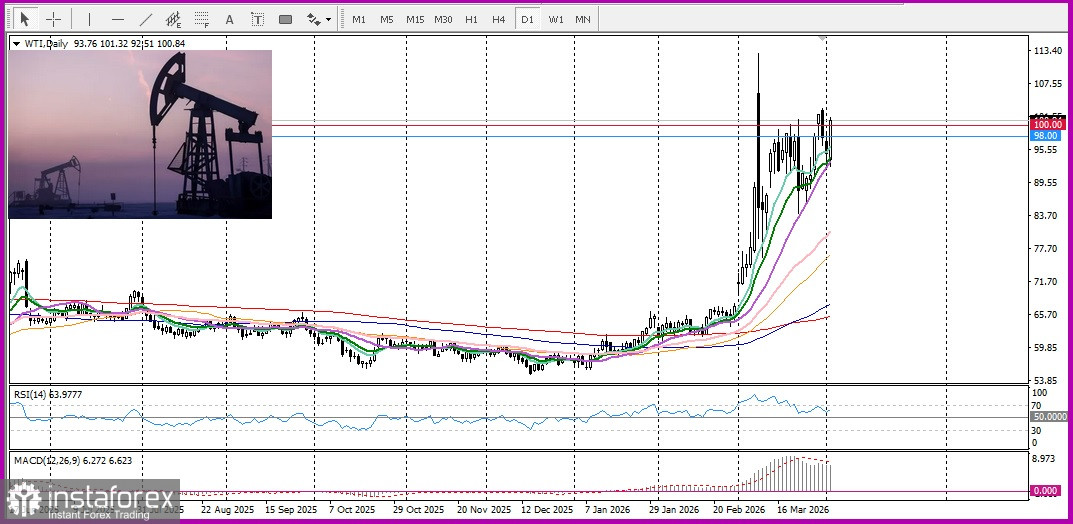
In an address to the nation, Trump warned that if no agreement is reached, Iran could face extremely harsh strikes within the next two to three weeks, potentially involving large-scale destruction of infrastructure. He also emphasized that the country's energy sector remains a potential target. These statements triggered a sharp rise in oil prices and increased inflation risks. Against this backdrop, expectations of tighter monetary policy by the U.S. Federal Reserve are strengthening, which further supports the dollar and puts pressure on EUR/USD.
From a technical perspective, the inability to consolidate above the 100-period simple moving average (SMA) on the 4-hour chart, as well as a pullback from the supply zone of 1.1620–1.1625, favors sellers. The MACD indicator, after briefly expanding in positive territory, is returning to the zero line, while the histogram is shrinking, signaling a weakening bullish impulse. Additionally, the Relative Strength Index (RSI) is falling below 50, reflecting a loss of directional momentum.
The nearest support is forming around 1.1520, where the 20-period SMA on the 4-hour chart passes. A break below this level will open the way for a decline toward the 1.1450 level. On the other hand, the initial resistance lies at 1.1590, ahead of the round level of 1.1600. This is followed by the 1.1610–1.1620 level, where previous local highs coincide, and then the 200-period SMA, forming a key barrier. To resume a sustained uptrend, a confident consolidation above this zone will be required, while a drop below 1.1515 will shift market focus toward 1.1450.
*El análisis de mercado publicado aquí tiene la finalidad de incrementar su conocimiento, más no darle instrucciones para realizar una operación.
¡Los informes analíticos de InstaSpot lo mantendrá bien informado de las tendencias del mercado! Al ser un cliente de InstaSpot, se le proporciona una gran cantidad de servicios gratuitos para una operación eficiente.


