


¡Nuestro equipo cuenta con más de 7,000,000 operadores!
Cada día, trabajamos juntos para mejorar las operaciones. Obtenemos grandes resultados y seguimos adelante.
El reconocimiento de millones de operadores en todo el mundo es el mejor agradecimiento a nuestro trabajo! ¡Usted hizo su elección y haremos todo lo que esté a nuestro alcance para satisfacer sus expectativas!
¡Juntos somos un gran equipo!
InstaSpot. ¡Orgulloso de trabajar para usted!


¡Actor, 6 veces ganador del torneo UFC y un verdadero héroe!
El hombre que se hizo a sí mismo. El hombre que sigue nuestro camino.
El secreto detrás del éxito de Taktarov es el constante movimiento hacia el objetivo.
¡Revele todo los lados de su talento!
Descubra, intente, fracase, ¡pero nunca se rinda!
InstaSpot. ¡Su historia de éxito comienza aquí!
The GBP/USD pair also continued its almost catastrophic decline on Friday. In the morning, the UK released reports on January GDP and industrial production, both of which were weaker than forecasts. Theoretically, it can be concluded that British data prompted the decline of the British currency in the first half of the day; however, the 5-minute timeframe clearly shows that the decline began overnight. Most likely, the British reports did push traders to sell, but the macroeconomic background is clearly not the only reason for the troubles of the British currency over the last month and a half. In the second half of the day, disappointing US data were released, but the dollar continued to rise, just as in the first half. Unfortunately, the situation in the Middle East is not improving, and soon both the Hormuz Strait and the Bab-al-Mandab Strait could potentially be blocked.
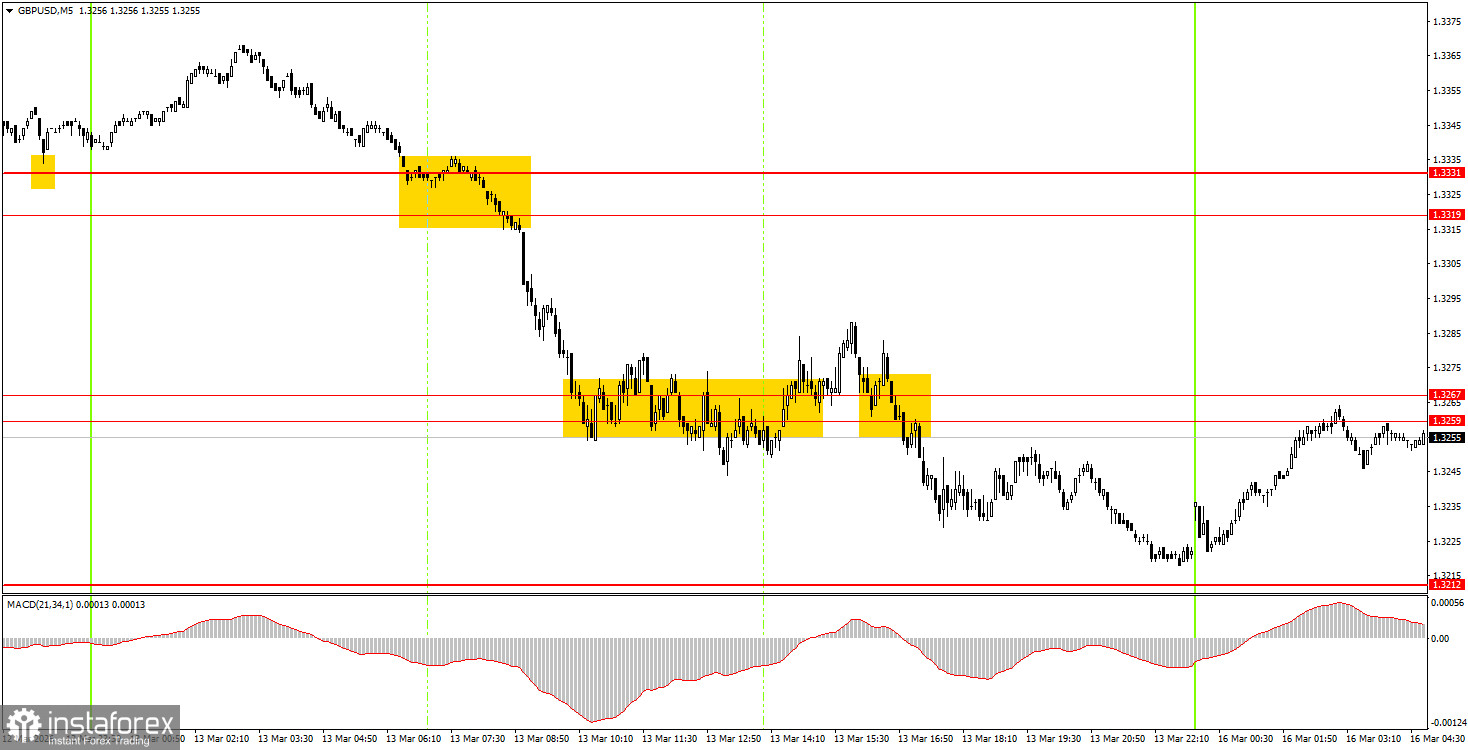
On the 5-minute timeframe, three trading signals were formed on Friday. At the beginning of the European trading session, the pair broke through the area of 1.3319-1.3331, and an hour later it reached the area of 1.3259-1.3267, where it got stuck for several hours. A false buy signal was generated. In the American trading session, the pair formed another sell signal by breaking through 1.3259-1.3267. By the end of the day, the level of 1.3212 was almost achieved.
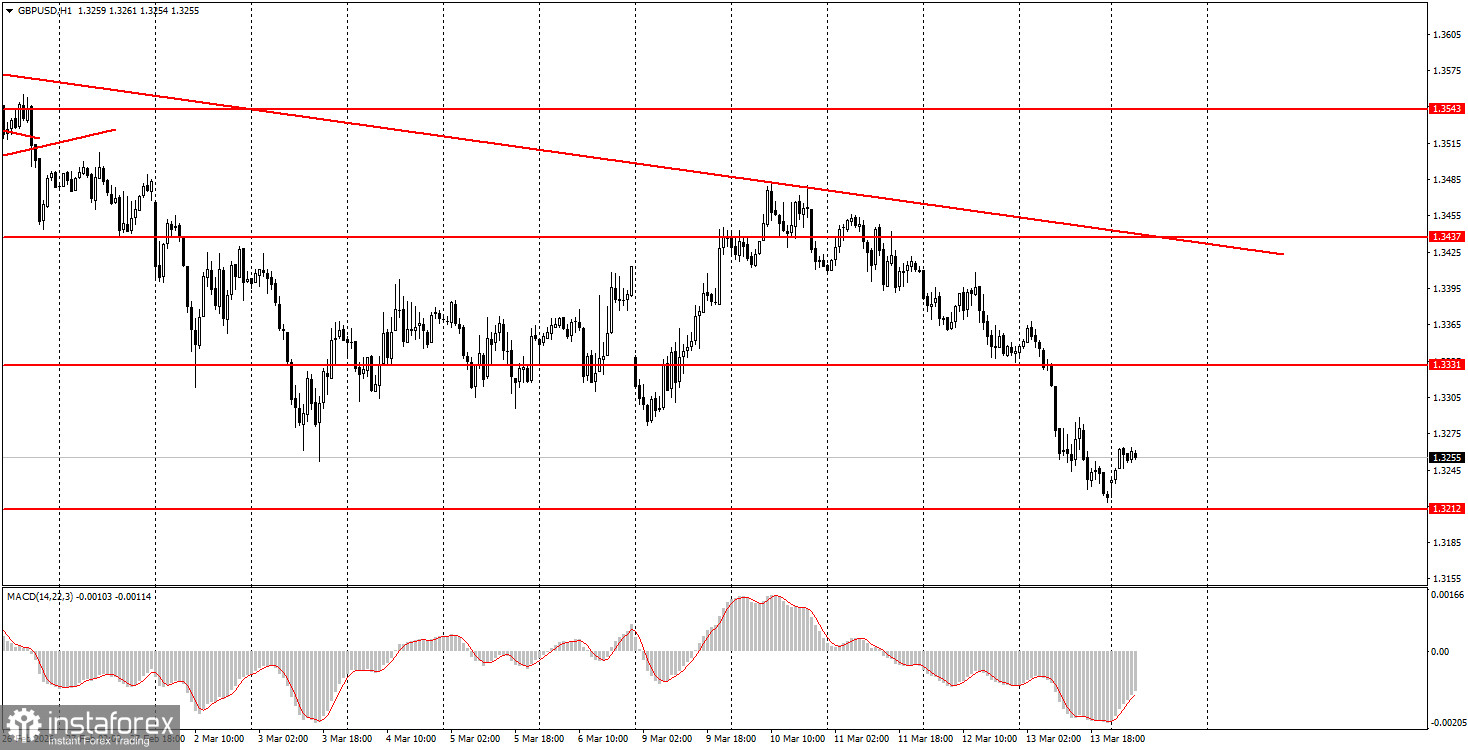
On the hourly timeframe, the GBP/USD pair continues to form a "geopolitical trend." There are no global grounds for a medium-term rise in the dollar, so in 2026, we expect a resumption of the global upward trend of 2025, which could push the pair to at least 1.4000. However, in recent weeks, the situation has almost always been unfavorable for the British currency, and the market is completely focused on the war in the Middle East, which directly affects the value of the American currency.
On Monday, novice traders may open short positions if there is a bounce from the 1.3259-1.3267 area, targeting 1.3203-1.3212. If the price consolidates above the 1.3259-1.3267 area, long positions may be opened with targets of 1.3319-1.3331.
On the 5-minute timeframe, trading can be done at the following levels: 1.3096-1.3107, 1.3203-1.3212, 1.3259-1.3267, 1.3319-1.3331, 1.3403-1.3407, 1.3437-1.3446, 1.3484-1.3489, 1.3529-1.3543, 1.3643-1.3652, 1.3695, and 1.3741-1.3751. On Monday, there are no important events scheduled in either the US or the UK. However, the flow of geopolitical news remains strong, and the situation in the Middle East continues to escalate, which is supporting growth prospects for the American currency.
Price levels of support and resistance are levels that serve as targets when opening buys or sells. Take Profit levels can be placed around them.
Red lines represent channels or trend lines that show the current trend and indicate the direction in which it is preferable to trade now.
The MACD indicator (14,22,3) – the histogram and the signal line – is a supporting indicator that can also be used as a source of signals.
Important speeches and reports (always included in the news calendar) can significantly affect the movement of the currency pair. Therefore, during their release, trading should be done with utmost caution, or traders should exit the market to avoid sharp price reversals against the previous movement.
Beginning traders in the forex market should remember that not every trade can be profitable. Developing a clear strategy and effective money management are the keys to long-term trading success.
*El análisis de mercado publicado aquí tiene la finalidad de incrementar su conocimiento, más no darle instrucciones para realizar una operación.
¡Los informes analíticos de InstaSpot lo mantendrá bien informado de las tendencias del mercado! Al ser un cliente de InstaSpot, se le proporciona una gran cantidad de servicios gratuitos para una operación eficiente.


