


¡Nuestro equipo cuenta con más de 7,000,000 operadores!
Cada día, trabajamos juntos para mejorar las operaciones. Obtenemos grandes resultados y seguimos adelante.
El reconocimiento de millones de operadores en todo el mundo es el mejor agradecimiento a nuestro trabajo! ¡Usted hizo su elección y haremos todo lo que esté a nuestro alcance para satisfacer sus expectativas!
¡Juntos somos un gran equipo!
InstaSpot. ¡Orgulloso de trabajar para usted!


¡Actor, 6 veces ganador del torneo UFC y un verdadero héroe!
El hombre que se hizo a sí mismo. El hombre que sigue nuestro camino.
El secreto detrás del éxito de Taktarov es el constante movimiento hacia el objetivo.
¡Revele todo los lados de su talento!
Descubra, intente, fracase, ¡pero nunca se rinda!
InstaSpot. ¡Su historia de éxito comienza aquí!
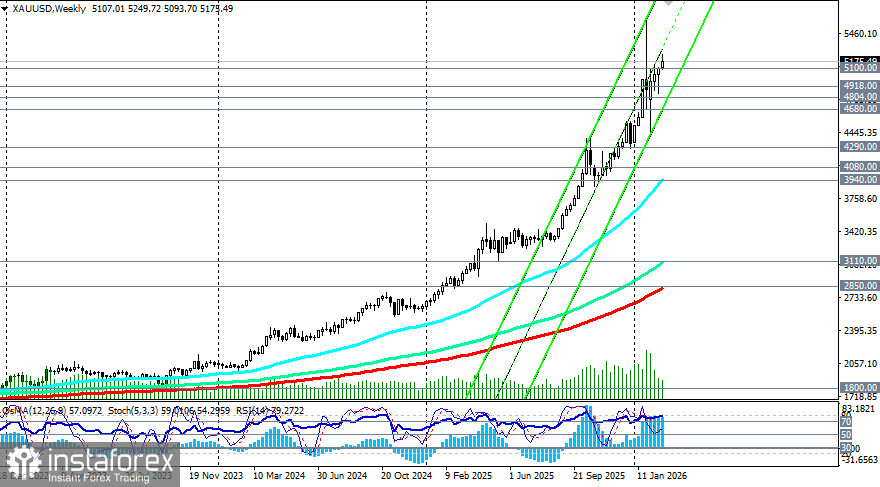
For the second day in a row, XAU/USD is trading in the range of 5150.00–5200.00. Attempts to consolidate above 5200.00 have yet to gain sustained traction, reflecting investor caution ahead of key geopolitical and macroeconomic events. The sideways price dynamics suggest a balance between the demand for safe assets due to geopolitical risks and support for the U.S. dollar in light of revised Fed rate expectations.
Despite the current consolidation, a broader upward trend remains intact. Following a correction from the historical high around 5598.00, the price established a base around 4400.00, then recovered, forming a structure of higher lows.
In the main scenario, still relying on fundamental assessments, we expect growth to continue. A breakout of Thursday's high at 5204.00 could serve as the first signal for new purchases, followed by a breakthrough of the weekly high at 5250.00.
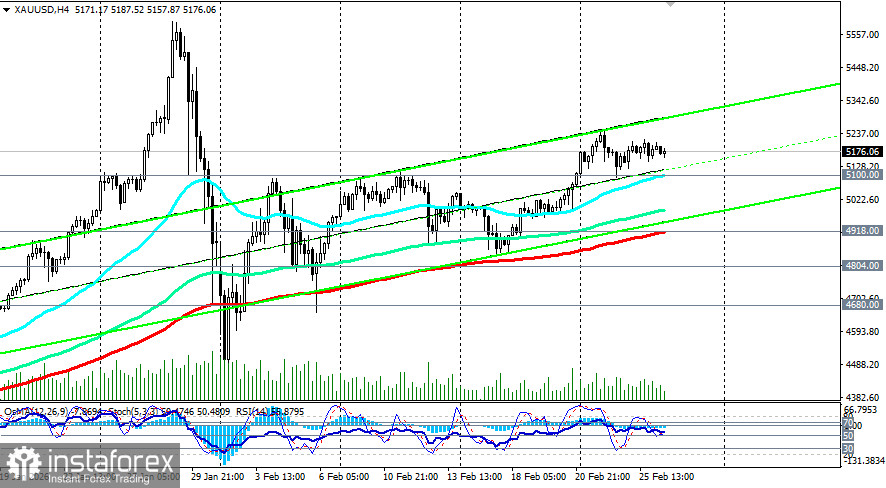
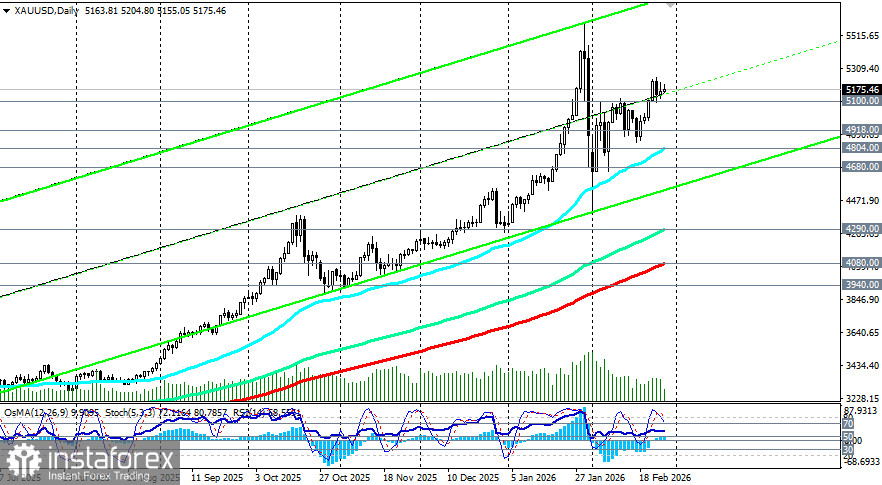
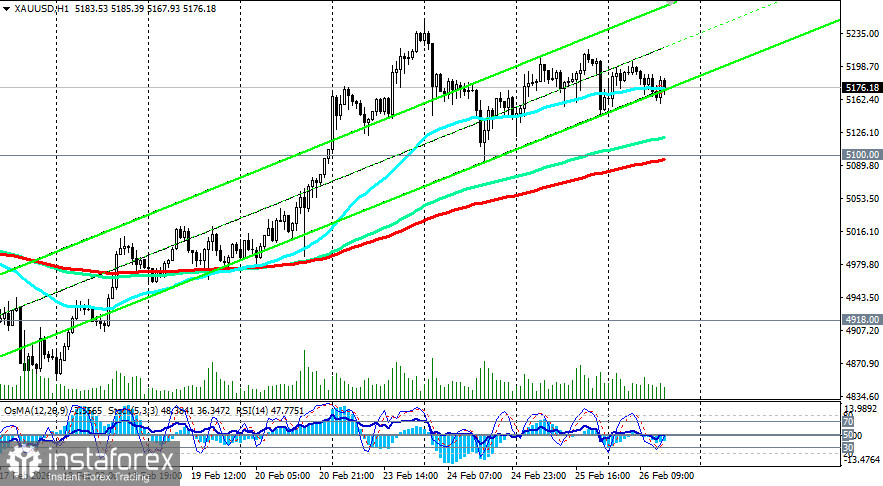
In the absence of unexpected and unaccounted events, a pullback to support levels of 5100.00 (200 EMA on the 1-hour chart), 5000.00, and 4918.00 (200 EMA on the 4-hour chart) provides additional opportunities to enter long positions at more favorable prices.
Technical indicators (in this case, RSI, OsMA, and Stochastic), despite pointing to short positions on short-term timeframes, remain on the buyers' side on the daily, weekly, and monthly charts, signaling continued potential for price growth.
At the same time, for a full bullish impulse to resume, a confident breakout above 5240.00–5250.00 is required.
Bullish Scenario (escalation of geopolitical risks, weak U.S. inflation data, dollar weakening): A breakout of 5200.00 with nearest targets for growth at 5250.00 and beyond – up to 5500.00.
Bearish Scenario (diplomatic breakthrough U.S.-Iran, strong inflation data in the U.S., rising yields and strengthening dollar): A breakout of the short-term support zone at 5122.00 (144 EMA on the 1-hour chart) – 5100.00 (200 EMA on the 1-hour chart) and a decline to 4804.00 (50 EMA on the daily chart) – 4680.00, from where purchases can be planned again.
Strategically, gold remains supported by ongoing geopolitical instability, trade risks, and expectations of future Fed easing (even if timelines shift).
However, short-term dynamics will depend on key triggers: U.S. inflation and labor market data, yields on 10-year USTs, the outcomes of U.S.-Iran negotiations, and Fed rhetoric.
5150.00, 5120.00, 5100.00, 5000.00, 4918.00, 4900.00, 4804.00, 4700.00, 4680.00, 4600.00
5200.00, 5205.00, 5220.00, 5250.00, 5300.00, 5400.00, 5500.00, 5600.00, 5700.00
Here, the "Targets" correspond to support/resistance levels. This also does not mean that they will necessarily be reached, but they can serve as a guide when planning and placing your trades.
*El análisis de mercado publicado aquí tiene la finalidad de incrementar su conocimiento, más no darle instrucciones para realizar una operación.
¡Los informes analíticos de InstaSpot lo mantendrá bien informado de las tendencias del mercado! Al ser un cliente de InstaSpot, se le proporciona una gran cantidad de servicios gratuitos para una operación eficiente.


