


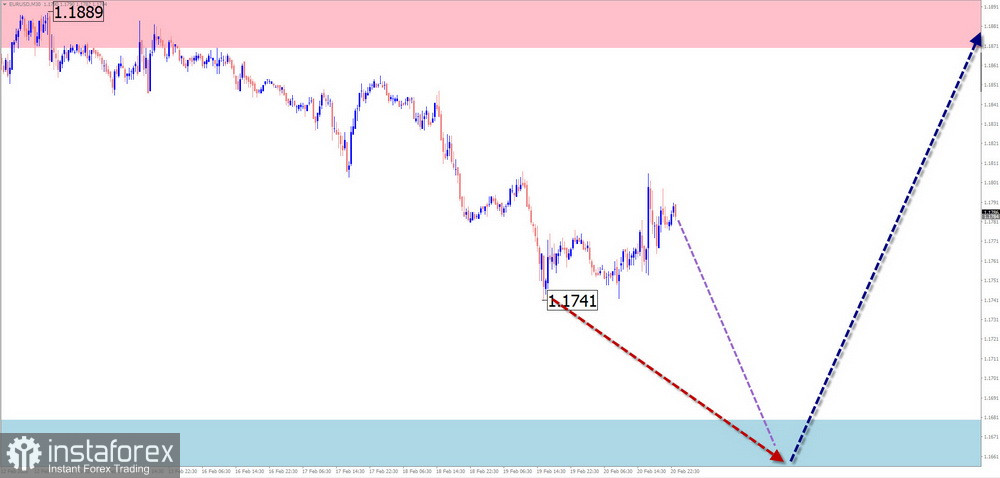
EUR/USD
Analysis:
The unfinished bearish wave structure on the chart of the European currency major has been counting from the spring of last year. In the larger wave model, this wave forms a running flat. Since January 27, the final segment (C) has been forming within the wave structure. At the time of analysis, quotes are within the daily time frame's potential reversal zone.
Forecast:
In the coming days, a gradual move of the euro toward the calculated support area is expected. After that, a reversal and growth of the pair toward the resistance zone may occur. When the direction changes, increased volatility is possible, including a short-term break below the lower boundary of the reversal zone.
Potential Reversal Zones
Resistance:
Support:
Recommendations:
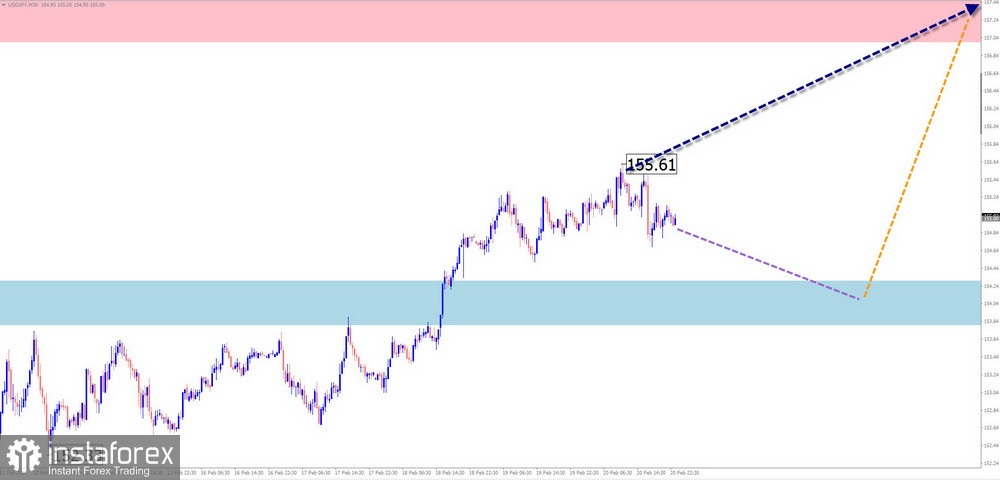
USD/JPY
Analysis:
When analyzing the wave situation for the Japanese yen market, the most interesting structure is the unfinished upward wave that started on April 22 last year. At the time of analysis, the wave has completed its corrective phase. Since late January, an upward zigzag wave with reversal potential has been forming on the chart.
Forecast:
At the beginning of the current week, conditions for a reversal are expected to form near the support zone. A brief break below the lower boundary of this zone cannot be ruled out. After that, growth is expected to resume. The upper boundary of the projected weekly movement is defined by the calculated resistance level.
Potential Reversal Zones
Resistance:
Support:
Recommendations:
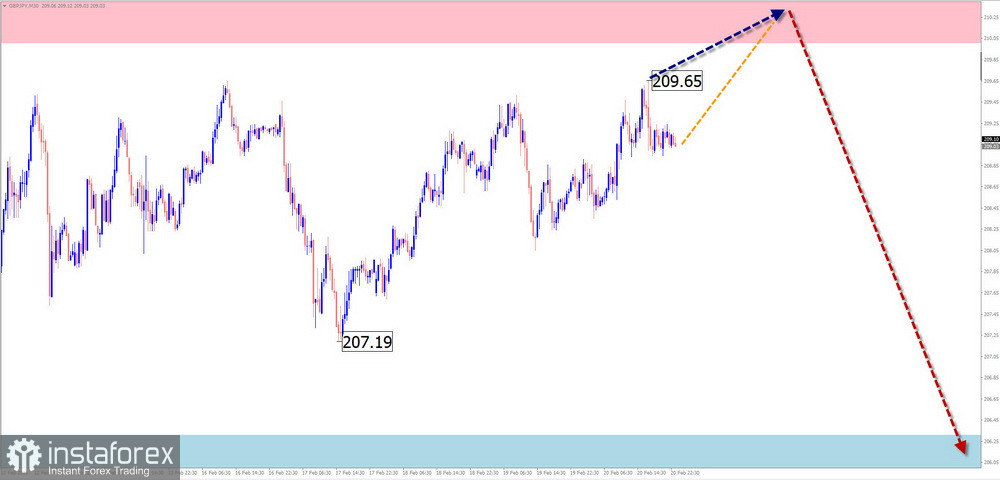
GBP/JPY
Analysis:
Since April last year, the price movement of the British pound/Japanese yen pair has been determined by an upward wave algorithm. After a corrective phase, the pair is forming the beginning of the final segment (C). The reversal model has the irregular shape of a running flat.
Forecast:
At the beginning of the coming week, sideways price movement with an upward bias is expected. Then the pair may move along the boundaries of the calculated resistance, forming conditions for a reversal. A resumption of price decline is more likely in the second half of the week. When the direction changes, a sharp increase in volatility is possible.
Potential Reversal Zones
Resistance:
Support:
Recommendations:
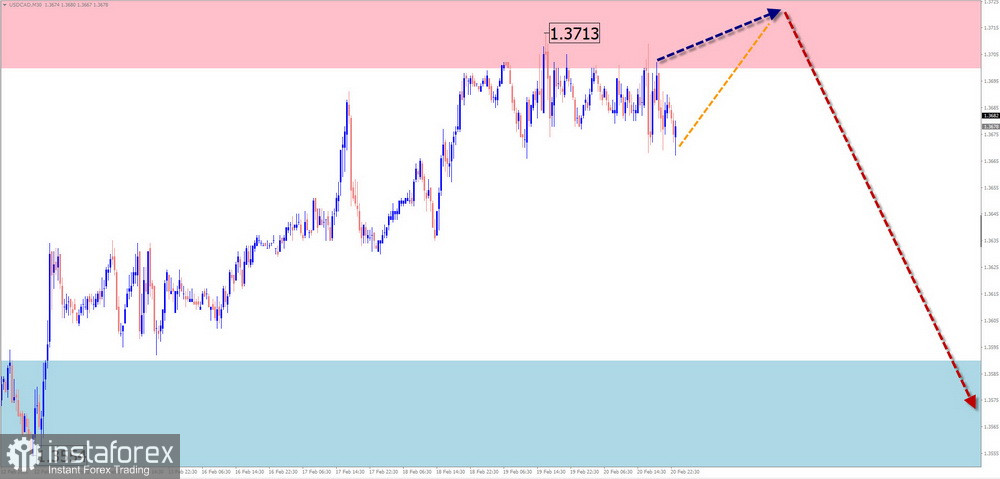
USD/CAD
Analysis:
On the chart of the Canadian dollar major pair, an upward wave with high wave potential remains relevant. In recent weeks, the price has been forming the beginning of the final segment (C). At the time of analysis, quotes are near the upper boundary of the price corridor. There are no immediate reversal signals on the chart.
Forecast:
In the first half of the coming week, sideways price fluctuations are expected. Pressure on the upper boundary of the resistance zone is possible. Closer to the weekend, after conditions for a change in direction form, a decline toward support levels may begin.
Potential Reversal Zones
Resistance:
Support:
Recommendations:
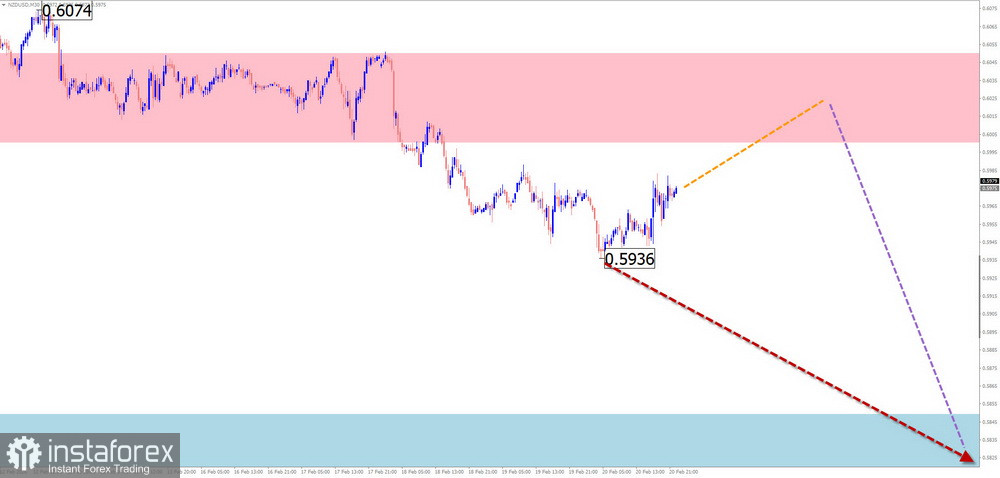
NZD/USD
Analysis:
Since April last year, the price direction of the New Zealand dollar major pair has been determined by an upward wave algorithm. Since November, the final phase (C) has been developing within its structure. Over the past three weeks, the chart has shown a corrective pattern in the form of a horizontal extended flat.
Forecast:
In the coming week, continuation of the downward price movement is expected, up to its completion near calculated support. In the first days, an upward bias is more likely, with a repeated move toward resistance. Increased volatility, a reversal, and the start of a downward move can be expected closer to the weekend.
Potential Reversal Zones
Resistance:
Support:
Recommendations:
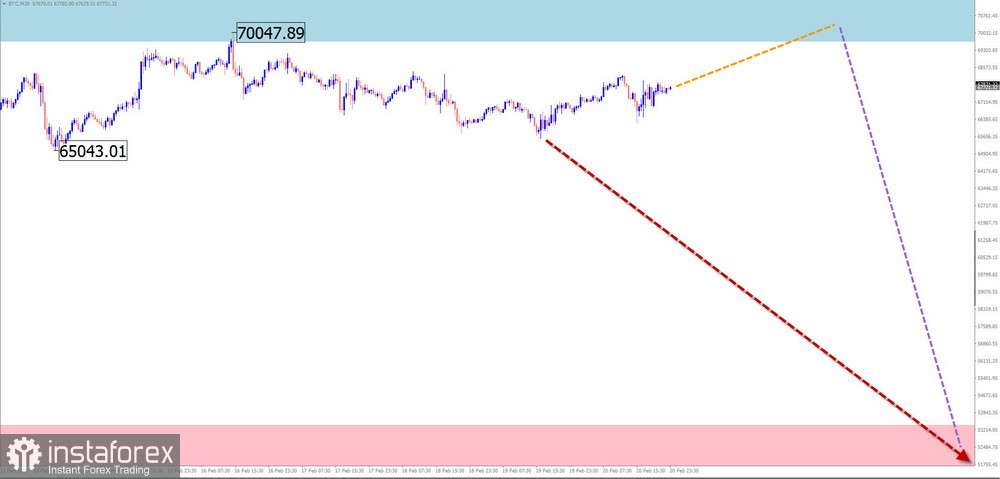
Bitcoin
Analysis:
In recent months, Bitcoin's price fluctuations have been driven by a downward wave algorithm. Since February 6, a bullish correction has been developing in a sideways flat pattern. Quotes are moving along the lower boundary of a large-scale potential reversal zone.
Forecast:
At the beginning of the coming week, the coin price is highly likely to continue moving sideways along the calculated resistance. In the second half of the week, a decline toward the boundaries of calculated support can be expected.
Potential Reversal Zones
Resistance:
Support:
Recommendations:
Notes: In simplified wave analysis (SWA), all waves consist of three parts (A–B–C). In each time frame, the latest unfinished wave is analyzed. Dotted lines indicate expected movements.
Attention: The wave algorithm does not take into account the duration of price movements over time.
*El análisis de mercado publicado aquí tiene la finalidad de incrementar su conocimiento, más no darle instrucciones para realizar una operación.
¡Los informes analíticos de InstaSpot lo mantendrá bien informado de las tendencias del mercado! Al ser un cliente de InstaSpot, se le proporciona una gran cantidad de servicios gratuitos para una operación eficiente.


