


¡La leyenda en el equipo de InstaSpot!
¡Leyenda! ¿Cree que es una retórica grandilocuente? Pero, ¿cómo deberíamos llamar a un hombre, que se convirtió en el primer asiático en ganar el campeonato mundial de ajedrez júnior a los 18 años y en el primer Gran Maestro indio a los 19 años? Ese fue el comienzo de un camino difícil hacia el título de Campeón del Mundo para Viswanathan Anand, el hombre que se convirtió en parte de la historia del ajedrez para siempre. ¡Ahora una leyenda más en el equipo de InstaSpot!


Borussia es uno de los clubes de fútbol con más títulos en Alemania, que ha demostrado repetidamente a los fanáticos: el espíritu de competencia y liderazgo que ciertamente conducirán al éxito. Opere de la misma manera que los profesionales del deporte: con confianza y de forma activa. ¡Mantenga un "pase" del Borussia FC y lidere con InstaSpot!
Last Friday, several market entry points were formed. Let us look at the 5-minute chart and analyze what happened. In my morning forecast, I highlighted the 1.3432 level and planned to make entry decisions based on it. The rise and the formation of a false breakout around 1.3432 triggered a sell entry for the pound, which sent the pair falling toward the target at 1.3403. In the second half of the day, active bull activity around 1.3403 produced a buy entry for the pound, but after a 20-pip move, buyer demand sharply weakened.
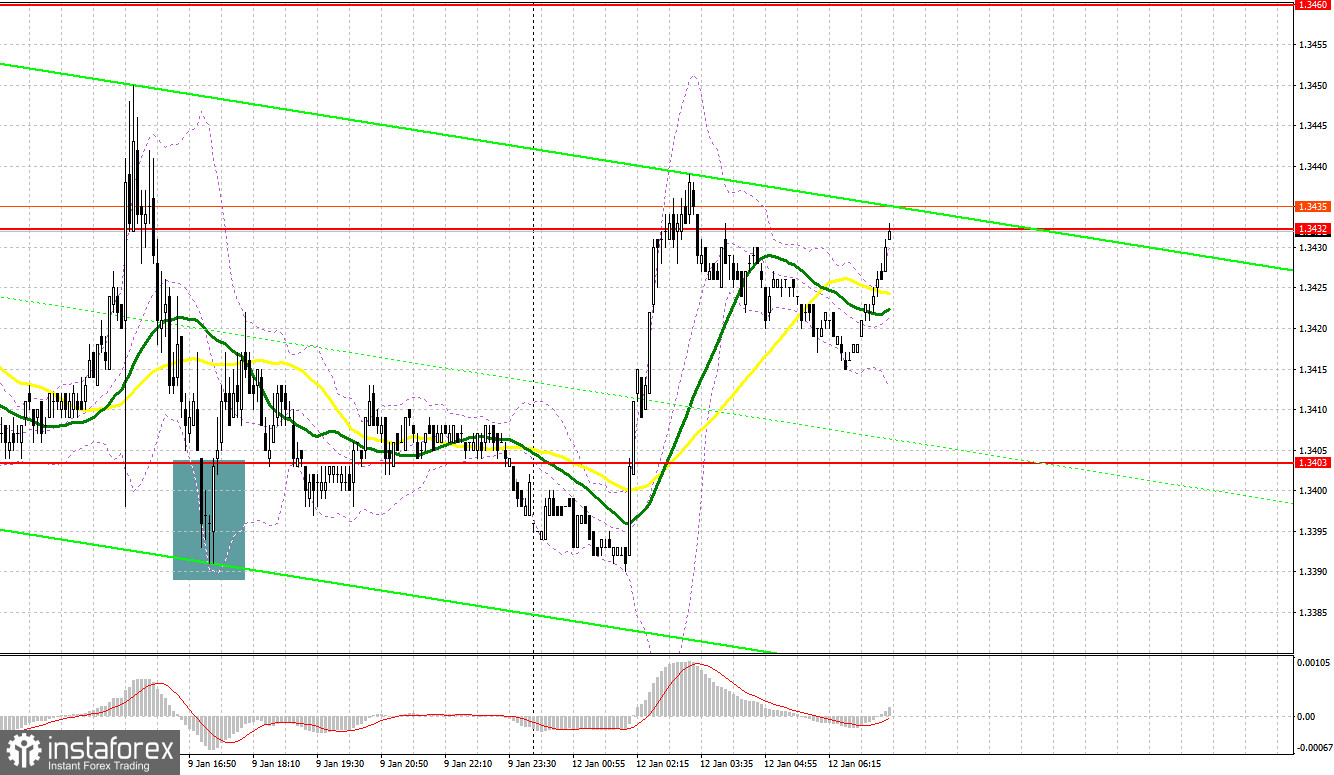
The pound fell on news that US unemployment had fallen to 4.4%, which pushed GBP/USD to a new weekly low. There are no fundamental UK releases today, so the morning bullish tone for the pound may persist during European trading. If downside pressure returns, bulls can count on the nearest support at 1.3403. Only if there is a false breakout will there be a good opportunity to open long positions, with a target to rise to the resistance at 1.3432, where trading is currently occurring. A breakout and reverse test of that range from above — which failed last Friday — would restore chances for GBP/USD strength, lead to stop-loss hunting among shorts, and provide a suitable entry to go long toward 1.3460, where I expect a stronger bear response. The far target is the 1.3488 area, where I will take profit. In the event of a GBP/USD decline and the absence of buyer activity at 1.3403, pressure on the pair will increase and could push it toward the next support at 1.3373. Only if there is a false breakout will there be an appropriate condition to open long positions. I plan to buy GBP/USD immediately on a rebound from the 1.3341 low, targeting a 30–35 pip intraday correction.
Pound sellers achieved a weekly low, but as the chart shows, they could not keep the market under control today. In the case of a further intraday correction, only a false breakout around 1.3432 will be a signal to sell GBP/USD, targeting a fall to support at 1.3403. A breakout and reverse test from below that range would deliver a larger blow to buyer positions, triggering stop-losses and opening the way to 1.3373. The far target is the 1.3341 area, where I will take profit; testing that level would establish a new bearish trend. If GBP/USD moves up and bears are inactive at 1.3432 — where moving averages run favoring bears — buyers will have a chance for a correction to 1.3460. I will open short positions there only on a failed breakout. If no downward move occurs there either, I will sell GBP/USD immediately on a rebound from 1.3488, but only expecting a 30–35 pip intraday correction downward.
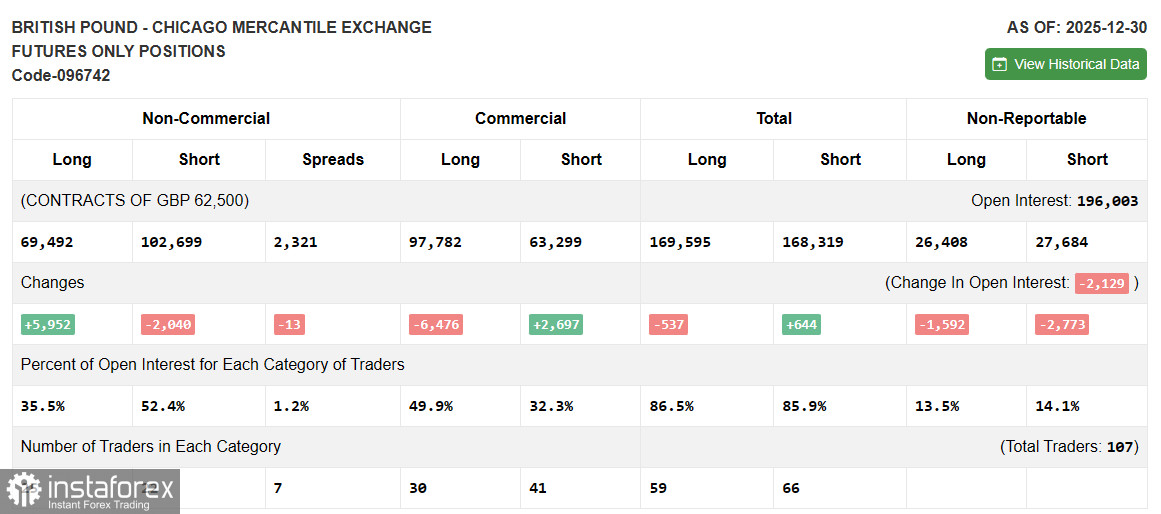
Due to the U.S. shutdown, fresh Commitment of Traders data are not published. As soon as an updated report is prepared, we will publish it. The latest available data are only as of December 30.
The COT report showed growth in long positions and a reduction in short positions. The latest COT report indicates that non-commercial long positions increased by 5,952 to 69,492, while non-commercial short positions decreased by 2,040 to 102,699. As a result, the spread between longs and shorts fell by 13.
Moving averages
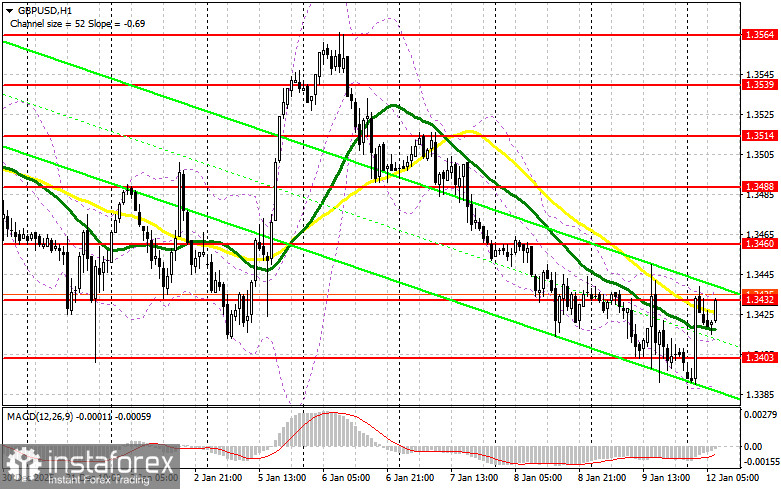
Trading is occurring around the 30- and 50-day moving averages, which indicates a possible correction in the pair.
Note: the moving average periods and price basis are considered by the author on the hourly H1 chart and differ from classic daily moving averages on the D1 chart.
Bollinger Bands
In case of a decline, the indicator's lower band around 1.3385 will act as support.
• Moving average — smooths volatility and noise to determine the current trend. Period — 50. Marked in yellow on the chart.
• Moving average — smooths volatility and noise to determine the current trend. Period — 30. Marked in green on the chart.
• MACD (Moving Average Convergence/Divergence) — fast EMA period 12, slow EMA period 26, signal SMA period 9.
• Bollinger Bands — period 20.
• Non-commercial traders — speculators such as retail traders, hedge funds, and large institutions using the futures market for speculative purposes and meeting certain criteria.
• Non-commercial long positions — the total long open position of non-commercial traders.
• Non-commercial short positions — the total short open position of non-commercial traders.
• Net non-commercial position — the difference between non-commercial long and short positions.
*El análisis de mercado publicado aquí tiene la finalidad de incrementar su conocimiento, más no darle instrucciones para realizar una operación.
¡Los informes analíticos de InstaSpot lo mantendrá bien informado de las tendencias del mercado! Al ser un cliente de InstaSpot, se le proporciona una gran cantidad de servicios gratuitos para una operación eficiente.


