


¡La leyenda en el equipo de InstaSpot!
¡Leyenda! ¿Cree que es una retórica grandilocuente? Pero, ¿cómo deberíamos llamar a un hombre, que se convirtió en el primer asiático en ganar el campeonato mundial de ajedrez júnior a los 18 años y en el primer Gran Maestro indio a los 19 años? Ese fue el comienzo de un camino difícil hacia el título de Campeón del Mundo para Viswanathan Anand, el hombre que se convirtió en parte de la historia del ajedrez para siempre. ¡Ahora una leyenda más en el equipo de InstaSpot!


Borussia es uno de los clubes de fútbol con más títulos en Alemania, que ha demostrado repetidamente a los fanáticos: el espíritu de competencia y liderazgo que ciertamente conducirán al éxito. Opere de la misma manera que los profesionales del deporte: con confianza y de forma activa. ¡Mantenga un "pase" del Borussia FC y lidere con InstaSpot!
The EUR/USD currency pair was more active on Tuesday and Wednesday, yet overall it didn't warrant a standing ovation. Consider this: on a highly informative Tuesday, the total volatility was only 75 pips. And that was on a day when a good dozen important macroeconomic reports were released in both the Eurozone and the U.S. Thus, we can draw a few conclusions that should be obvious to all. The first conclusion is that the flat trend on the daily timeframe remains relevant, which explains the relatively low volatility even on days when volatility would logically be the highest. The second conclusion is that the market was not impressed by the U.S. macroeconomic data it had anticipated for over two months. Honestly, the market ignored all data except for the NonFarm Payrolls and the unemployment rate. Therefore, we will focus on those reports.
There are no questions regarding the unemployment rate, but there are many regarding Nonfarm Payrolls. However, it's important to remember that seeing the figures alone isn't enough; one must understand how to relate them to one another. For example, how can we evaluate the NonFarm Payrolls report? The September report was revised upward, the October report was disappointing, and the November report exceeded forecasts by only 10,000. In the end, did NonFarm Payrolls please dollar enthusiasts or not? Perhaps the market can help us figure it out? No. Initially, the dollar fell sharply, then rose just as sharply, despite the absence of any significant events in either the EU or the U.S. on Wednesday, and it began rising even during the night with no significant news.
Further complicating matters, how does one reconcile the seemingly contradictory NonFarm figures with the unemployment rate? The unemployment report clearly disappointed, as its value significantly exceeded analysts' forecasts. But how do we interpret NonFarm Payrolls? Did NonFarm Payrolls overshadow negative unemployment? Or the opposite? And what is happening with the U.S. labor market? Is it beginning to recover? Have the three rounds of Federal Reserve monetary policy easing borne fruit? We believe that answers to these questions were not provided this week.
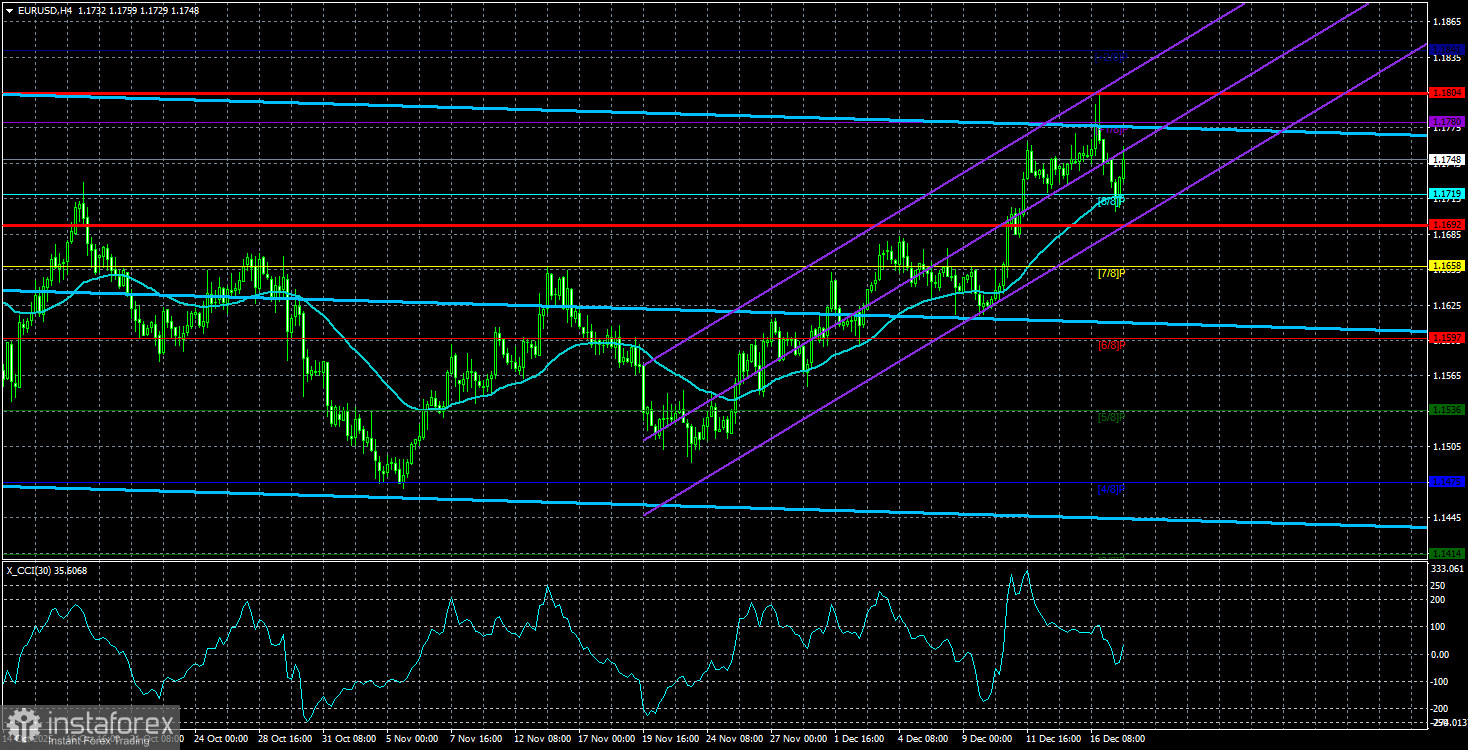
Thus, we do not see any reasons to conclude the local upward trend, but at the same time, we note that the EUR/USD pair has reached the upper boundary of the sideways channel of 1.1400-1.1830. Therefore, a technical reversal down is possible, with a return to the 1.1400 level. Unfortunately, this is the reality. If the price does not manage to consolidate above 1.1830 soon (not just liquidate but establish a firm holding), the flat will remain. This means we will continue to observe low volatility and illogical movements. Overall, the situation is not very favorable. However, the long-term outlook remains unchanged. The dollar still has no strong cards to play, and the Fed may decide to ease monetary policy again in January.
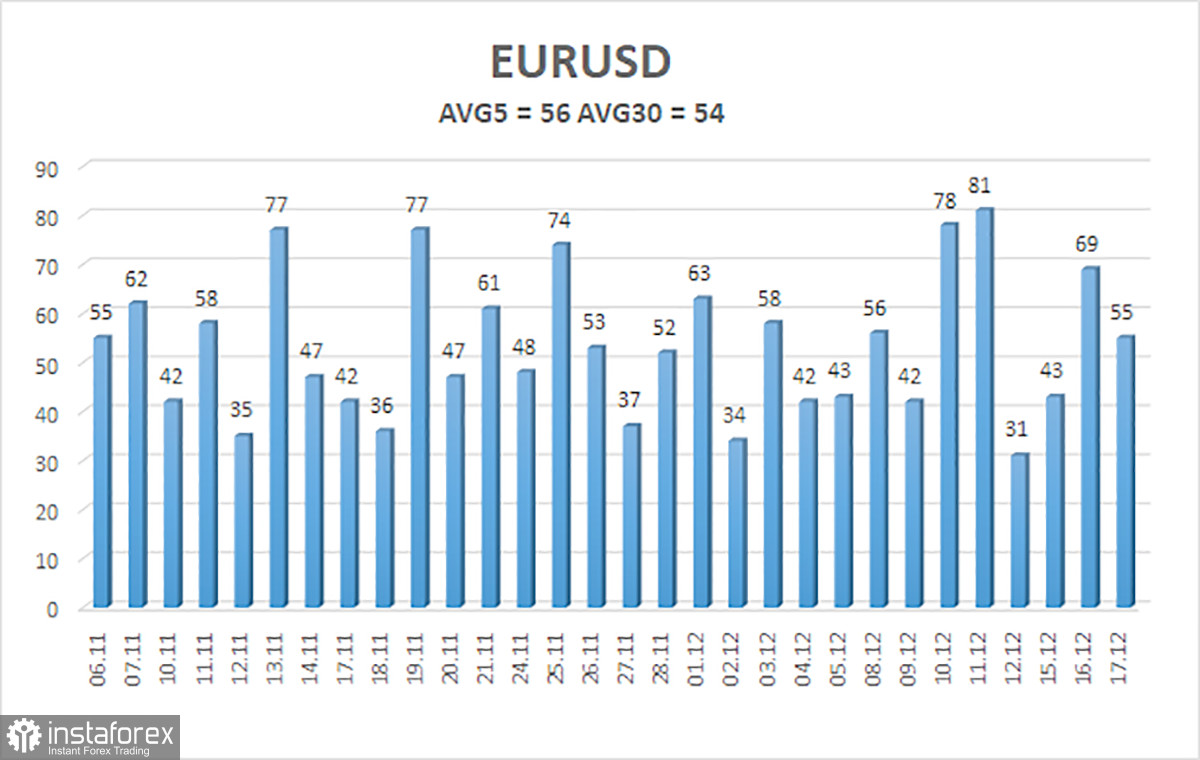
The average volatility of the EUR/USD pair over the last five trading days, as of December 18, is 56 pips and is characterized as "average." We expect the pair to trade between 1.1692 and 1.1804 on Thursday. The upper linear regression channel is directed downwards, signaling a downward trend, but, in fact, the flat continues on the daily timeframe. The CCI indicator entered oversold territory twice in October (!!!) but visited the overbought region last week. A downward retracement is possible.
On Thursday, traders may trade from the 1.1750-1.1760 area. A rebound from this area will make short positions relevant, targeting the Senkou Span B line. If the quote consolidates above this area, it will lead to another attempt to break out of the sideways channel of 1.1400-1.1830 through the upper boundary. In this case, long positions will become relevant.
*El análisis de mercado publicado aquí tiene la finalidad de incrementar su conocimiento, más no darle instrucciones para realizar una operación.
¡Los informes analíticos de InstaSpot lo mantendrá bien informado de las tendencias del mercado! Al ser un cliente de InstaSpot, se le proporciona una gran cantidad de servicios gratuitos para una operación eficiente.


