


¡La leyenda en el equipo de InstaSpot!
¡Leyenda! ¿Cree que es una retórica grandilocuente? Pero, ¿cómo deberíamos llamar a un hombre, que se convirtió en el primer asiático en ganar el campeonato mundial de ajedrez júnior a los 18 años y en el primer Gran Maestro indio a los 19 años? Ese fue el comienzo de un camino difícil hacia el título de Campeón del Mundo para Viswanathan Anand, el hombre que se convirtió en parte de la historia del ajedrez para siempre. ¡Ahora una leyenda más en el equipo de InstaSpot!


Borussia es uno de los clubes de fútbol con más títulos en Alemania, que ha demostrado repetidamente a los fanáticos: el espíritu de competencia y liderazgo que ciertamente conducirán al éxito. Opere de la misma manera que los profesionales del deporte: con confianza y de forma activa. ¡Mantenga un "pase" del Borussia FC y lidere con InstaSpot!
Ethereum continues to correct and may soon reach the only area of interest (POI) on the daily timeframe. In recent days, the technical picture has been somewhat confusing, primarily due to Bitcoin. It is primarily the patterns formed on Bitcoin across different timeframes that contradict each other. However, for Ethereum, the situation is clear. The target area for selling on the daily timeframe has not yet been worked off, and there are no signs that the correction is ending or that the trend is concluding. On the 4-hour timeframe, a reaction was received yesterday from the nearest bullish IFVG, with liquidity being cleared for buying. Thus, traders can observe a situation where Ethereum complements Bitcoin and clarify what to expect next. Currently, a continuation of the correction can be anticipated. While traders can capitalize on any movement, we continue to adhere to the classical approach of trading corrections for opening positions in the direction of the trend, rather than against it.
The trading strategy for the upcoming weeks may focus solely on identifying attractive areas for new sales. To consider buying, a break from the current downward trend is necessary, which will only occur above the $3,666 level (the CHOCH line). Thus, in the near term, traders can theoretically consider long positions only upon receiving signals on the 4-hour timeframe. This means they should look for opportunities within the short-term trend.
By the way, if Bitcoin falls below $75,000, the upward trend on the weekly timeframe will be broken. If this occurs, there will be technical grounds to expect not just a correction on a global scale, but rather a strong bearish trend in the long term. Guess where Ethereum and Solana will move in that case?
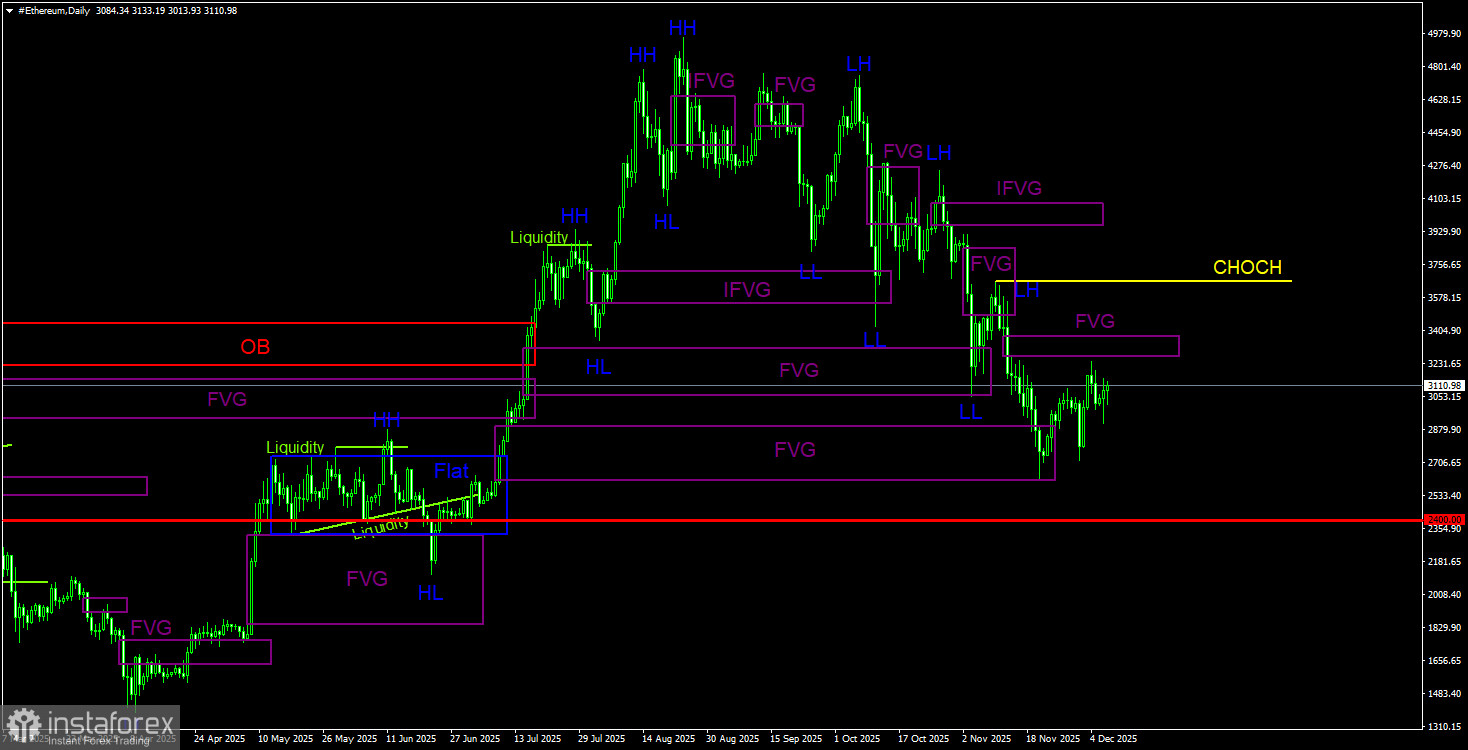
On the daily timeframe, Ethereum continues to form a downward trend but is currently correcting. During the "Black Friday" collapse, the first bullish FVG was worked off, and during "Black Tuesday," the second bullish FVG was worked off. During the latest declining phase, the third bullish FVG was established. The trend structure is currently clear and raises no questions. The CHOCH line is at $3,666—the last lower high (LH). As long as the price remains below it, the downward trend persists. In the near future, a correction may occur, with a clear target being the nearest unworked bearish FVG. Therefore, we continue to expect a reaction to this pattern with confirmation on the hourly timeframe.
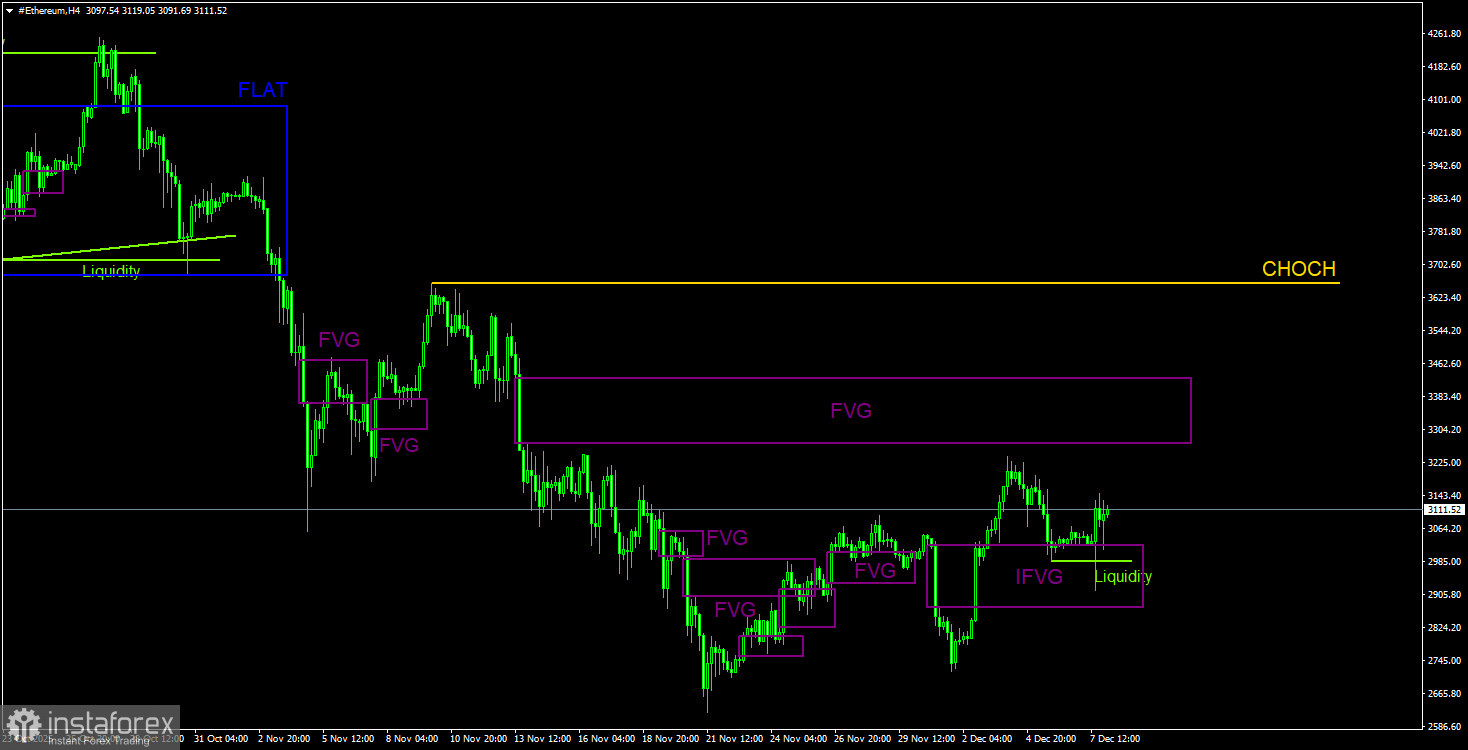
On the 4-hour timeframe, an upward correction is observed, which has developed its own structure. A bullish IFVG (from which the price reacted yesterday) and a bearish FVG (which nearly coincides with the FVG on the daily timeframe) remain relevant. Additionally, liquidity was cleared for buying, which reinforced the bullish signal from the IFVG. Thus, traders eager to open long positions had grounds to do so. We continue to expect sell signals to form in the designated areas.
The daily and 4-hour timeframes continue to show a downward trend formation. The key pattern for selling is the bearish order block on the weekly timeframe. The movement triggered by this signal should be strong and prolonged. Currently, the entire market is undergoing a correction, albeit a weak one. It is not certain that the trend will resume for Bitcoin/Ethereum in the single FVG, but this is the only area where opening new shorts would be reasonable and justified, provided there is confirmation. The bearish FVG on the daily timeframe is located in the range of $3,270 - $3,370. A price reaction can be expected from this area.
*El análisis de mercado publicado aquí tiene la finalidad de incrementar su conocimiento, más no darle instrucciones para realizar una operación.
¡Los informes analíticos de InstaSpot lo mantendrá bien informado de las tendencias del mercado! Al ser un cliente de InstaSpot, se le proporciona una gran cantidad de servicios gratuitos para una operación eficiente.


