


¡Nuestro equipo cuenta con más de 7,000,000 operadores!
Cada día, trabajamos juntos para mejorar las operaciones. Obtenemos grandes resultados y seguimos adelante.
El reconocimiento de millones de operadores en todo el mundo es el mejor agradecimiento a nuestro trabajo! ¡Usted hizo su elección y haremos todo lo que esté a nuestro alcance para satisfacer sus expectativas!
¡Juntos somos un gran equipo!
InstaSpot. ¡Orgulloso de trabajar para usted!


¡Actor, 6 veces ganador del torneo UFC y un verdadero héroe!
El hombre que se hizo a sí mismo. El hombre que sigue nuestro camino.
El secreto detrás del éxito de Taktarov es el constante movimiento hacia el objetivo.
¡Revele todo los lados de su talento!
Descubra, intente, fracase, ¡pero nunca se rinda!
InstaSpot. ¡Su historia de éxito comienza aquí!
Yesterday, Bitcoin surged more than 8%, recovering all the losses from the previous day, and today it has reached the $93,800 mark, clearly aiming for a return to the $100,000 level during the Santa Claus rally.

Meanwhile, the Strategy company, which has recently been under close scrutiny, acknowledged yesterday the possibility of selling BTC in the event of an extreme market situation. Previously, Saylor had stated that the company would never sell its BTC.
Pressure on the company has increased following the significant drop in the cryptocurrency market in November of this year, causing many investors and traders to question the stability of the firm, which holds a considerable record amount of BTC on its balance sheet.
The company stated that they were building reserves to withstand severe BTC drawdowns and to ensure they could maintain the company's value above the BTC balance for the next three years. They added that this meant, in the worst-case scenario, they would not have to sell BTC until 2029. Although this statement came with many caveats, it surprised many investors who firmly believed in Strategy's unwavering commitment to Bitcoin. The market reacted cautiously, suggesting some participants had already factored in such a scenario in their calculations. However, the long-term consequences of this rhetorical shift could be more significant.
As mentioned earlier, the possible reasons prompting Strategy to consider this step are evident. The decline in BTC prices in recent months has seriously impacted the company's financial performance, and increasing volatility only intensifies the pressure. In an unpredictable market environment, the willingness to consider selling a portion of assets can be seen as a sign of prudent risk management aimed at preserving financial stability.
On the other hand, such a move may undermine trust in Strategy as one of the main institutional holders of Bitcoin. Saylor's and the company's devotion to BTC has been a key factor supporting optimism in the market. Abandoning this narrative could lead to further declines in interest in cryptocurrency from institutional investors, negatively impacting its price.
Previously, the company also stated that it would sell its BTC only if the company's stock fell below the net asset value and all financing options disappeared.
Trading recommendations:
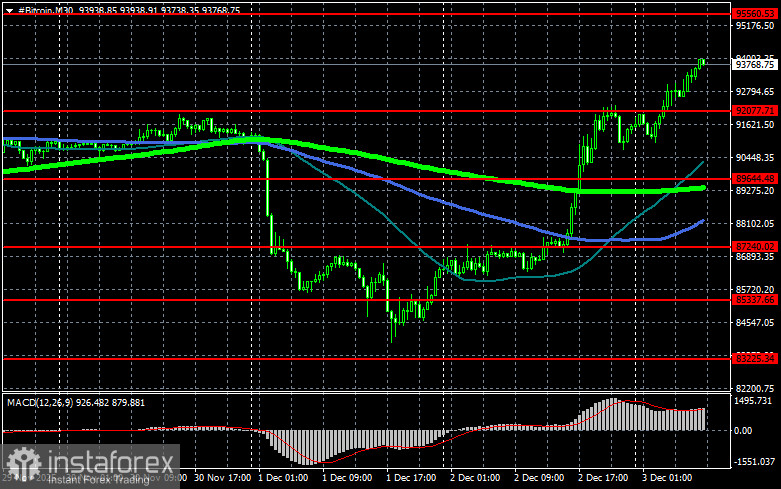
Regarding the technical picture for Bitcoin, buyers are currently targeting a return to the $95,500 level, which opens a direct route to $99,400. From there, it is only a short step to $102,400. The furthest target is around $105,300. Surpassing this level would represent attempts at a return to a bull market. If Bitcoin declines, I expect buyers around the $92,000 level. A drop below this area could quickly push BTC down to around $89,600, with the most distant target at $87,200.
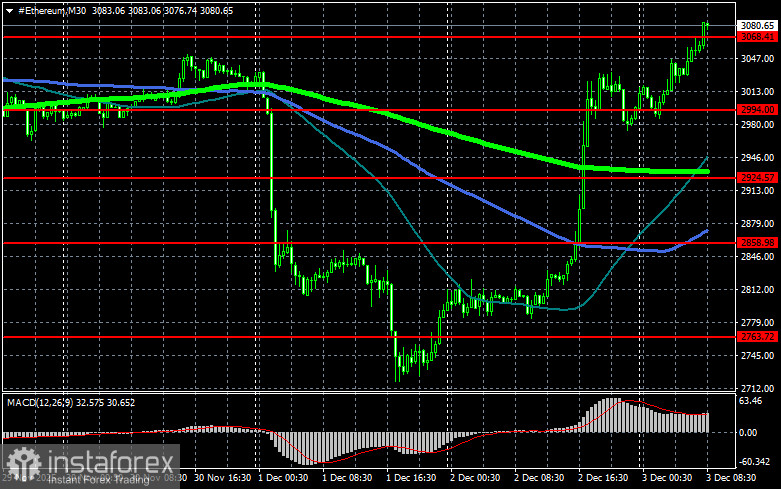
For Ethereum, clear consolidation above the $3,068 level opens the path to $3,193. The furthest target is around $3,317. Breaking above this level would signify strengthening bullish sentiment in the market and renewed interest from buyers. If Ethereum falls, I expect buyers at the $2,994 level. A return below this area could swiftly bring ETH down to around $2,924, with the most distant support at $2,858.
What we see on the chart:
- Red lines indicate support and resistance levels where either a price slowdown or active growth is expected;
- Green lines indicate the 50-day moving average;
- Blue lines indicate the 100-day moving average;
- Light green lines indicate the 200-day moving average.
Typically, a crossover or price test of these moving averages either halts market momentum or sets a new directional impulse.
*El análisis de mercado publicado aquí tiene la finalidad de incrementar su conocimiento, más no darle instrucciones para realizar una operación.
¡Los informes analíticos de InstaSpot lo mantendrá bien informado de las tendencias del mercado! Al ser un cliente de InstaSpot, se le proporciona una gran cantidad de servicios gratuitos para una operación eficiente.


