


¡Nuestro equipo cuenta con más de 7,000,000 operadores!
Cada día, trabajamos juntos para mejorar las operaciones. Obtenemos grandes resultados y seguimos adelante.
El reconocimiento de millones de operadores en todo el mundo es el mejor agradecimiento a nuestro trabajo! ¡Usted hizo su elección y haremos todo lo que esté a nuestro alcance para satisfacer sus expectativas!
¡Juntos somos un gran equipo!
InstaSpot. ¡Orgulloso de trabajar para usted!


¡Actor, 6 veces ganador del torneo UFC y un verdadero héroe!
El hombre que se hizo a sí mismo. El hombre que sigue nuestro camino.
El secreto detrás del éxito de Taktarov es el constante movimiento hacia el objetivo.
¡Revele todo los lados de su talento!
Descubra, intente, fracase, ¡pero nunca se rinda!
InstaSpot. ¡Su historia de éxito comienza aquí!
The GBP/USD currency pair once again traded lower on Wednesday, but this time with clear and valid reasons. Early in the session, the UK released an inflation report showing that the headline CPI for September remained unchanged, while core inflation even declined slightly. Though this drop was minimal, and the headline figure still exceeds the Bank of England's target by nearly twofold, the data likely served as a catalyst for the British pound's decline. Still, this conclusion is debatable.
Let's explain why. With inflation holding at 3.8%, it's highly unlikely that the Bank of England is actively considering another rate cut. The fact that inflation has ceased rising does not necessarily increase the likelihood of policy easing. Inflation in the UK remains elevated. Therefore, the latest report doesn't really strengthen the case for further monetary policy loosening by year-end. In our view, the market merely used a formal trigger as an excuse for more selling.
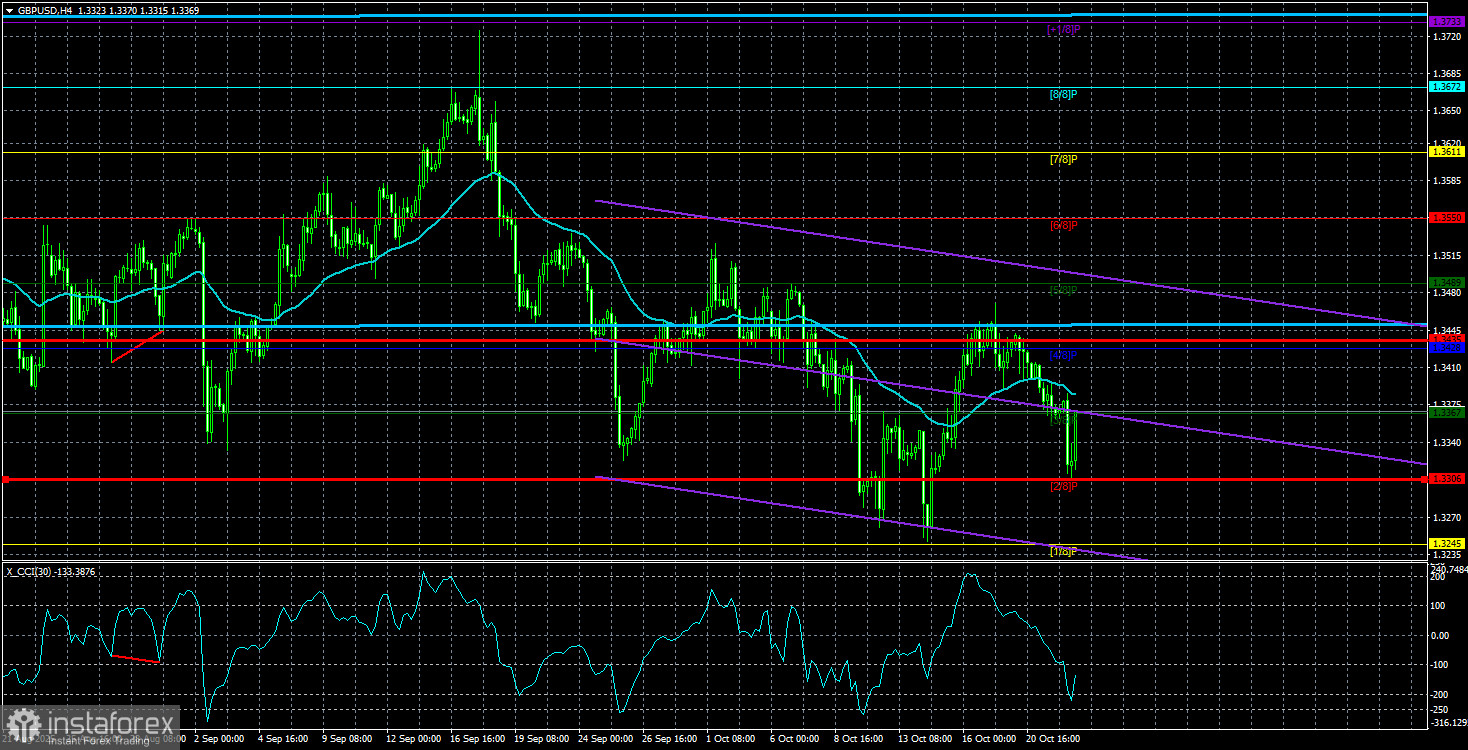
Furthermore, we've been witnessing an illogical rise in the U.S. dollar for about three weeks now. Since no convincing fundamental factors explain this move, we maintain our position that GBP/USD remains locked in a horizontal range on the daily time frame—a conclusion clearly observable on relevant charts. This flat structure explains the seemingly random and irrational price actions.
It's worth reminding that flat market phases often reflect strategic accumulation or distribution by market-makers. In simpler terms, the pair trades within a narrow range not because macroeconomic events continuously balance themselves out, but because major players are engaged in position management. If that's the case, any move within the range is best understood as capital-driven rather than sentiment-driven.
Notably, the Federal Reserve maintains a dovish stance—and yet, the dollar continues to appreciate. The market appears to justify this by saying, "Because the U.S. and China will eventually make a deal." The only major event left this week is the U.S. inflation report. And regardless of the outcome, the market may still use it as a reason to buy dollars. If inflation rises, the Fed might become less dovish — dollar up. If inflation drops, the Fed isn't dovish enough — dollar still up. Same event, different spin. It's less about logic and more about narrative convenience.
On the 4-hour chart, the price has slipped back below the moving average, and the CCI indicator may dip into the oversold area for the fourth time. Four repeated oversold signals from a single indicator suggest a potential bullish reversal is near.
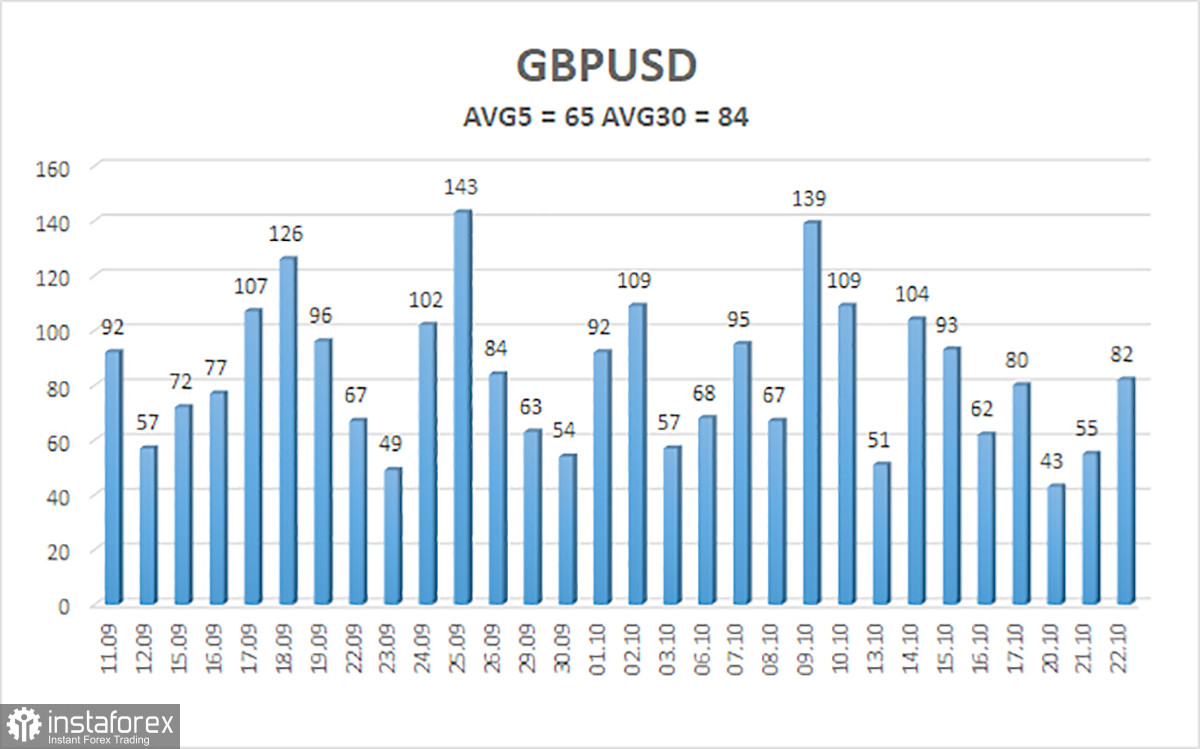
The average volatility for GBP/USD over the past five trading days is 65 pips, which is considered a "normal" range for the pair. We expect the pair to fluctuate within a range defined by the levels 1.3305 and 1.3435 on Thursday, October 23. The upper linear regression channel remains upward, indicating a clear long-term bullish trend.
GBP/USD is attempting to resume the broader uptrend of 2025. Its long-term outlook remains unchanged. Given the continued influence of Donald Trump's trade policies, we don't expect significant or lasting strength in the U.S. dollar.
Linear Regression Channels: used to determine current trend direction. If both channels point the same way, the trend is strong.
Moving Average (20.0, smoothed): sets short-term momentum and helps identify direction for trading decisions.
Murray Levels: serve as potential targets for movement and corrections.
Volatility Levels (red lines): projected price channel for the upcoming 24 hours based on recent volatility metrics.
CCI Indicator: readings below -250 or above +250 suggest that a trend reversal may be near (oversold or overbought conditions).
*El análisis de mercado publicado aquí tiene la finalidad de incrementar su conocimiento, más no darle instrucciones para realizar una operación.
¡Los informes analíticos de InstaSpot lo mantendrá bien informado de las tendencias del mercado! Al ser un cliente de InstaSpot, se le proporciona una gran cantidad de servicios gratuitos para una operación eficiente.


