


¡La leyenda en el equipo de InstaSpot!
¡Leyenda! ¿Cree que es una retórica grandilocuente? Pero, ¿cómo deberíamos llamar a un hombre, que se convirtió en el primer asiático en ganar el campeonato mundial de ajedrez júnior a los 18 años y en el primer Gran Maestro indio a los 19 años? Ese fue el comienzo de un camino difícil hacia el título de Campeón del Mundo para Viswanathan Anand, el hombre que se convirtió en parte de la historia del ajedrez para siempre. ¡Ahora una leyenda más en el equipo de InstaSpot!


Borussia es uno de los clubes de fútbol con más títulos en Alemania, que ha demostrado repetidamente a los fanáticos: el espíritu de competencia y liderazgo que ciertamente conducirán al éxito. Opere de la misma manera que los profesionales del deporte: con confianza y de forma activa. ¡Mantenga un "pase" del Borussia FC y lidere con InstaSpot!
Trend Analysis
This week, from the level of 1.3355 (the closing price of the last weekly candle), the price may continue to move downward, targeting 1.3141 — the 38.2% retracement level (red dashed line). Upon testing this level, the price may rebound upward toward 1.3270 — the historical support level (light blue dashed line).
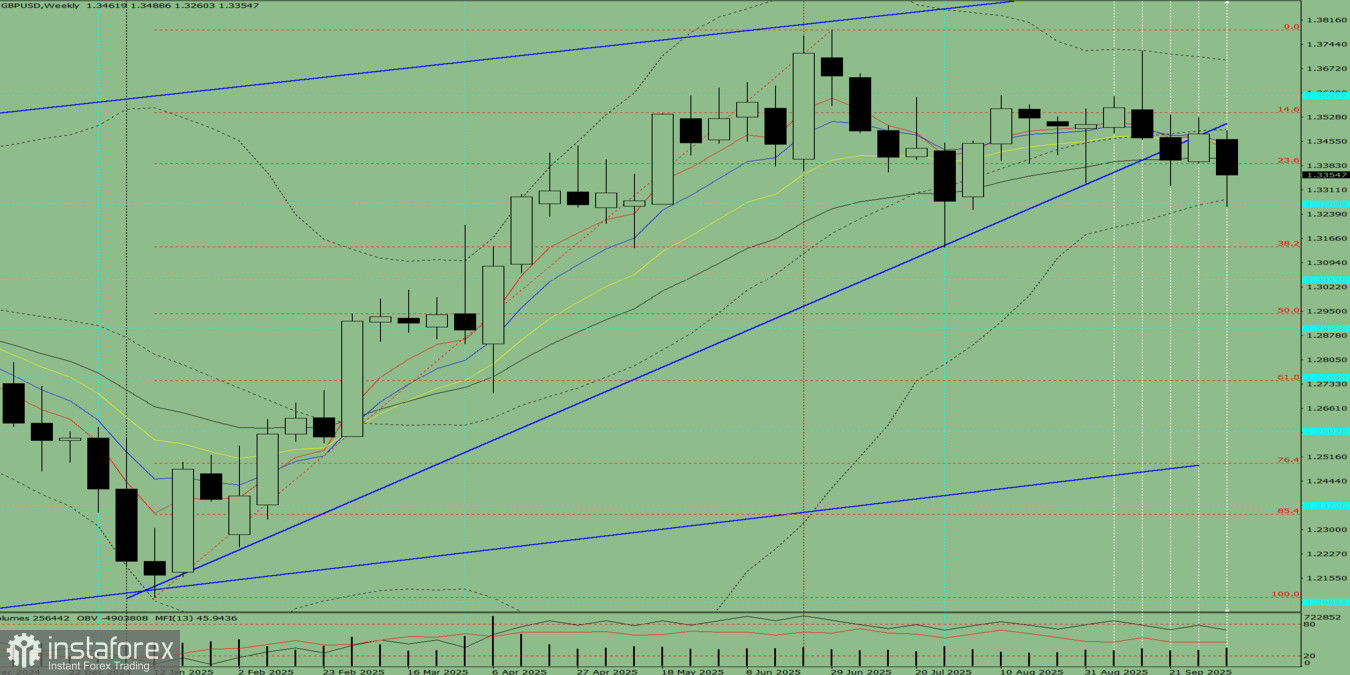
Figure 1: Weekly Chart
Comprehensive Analysis
Overall Conclusion
Based on the weekly chart, the GBP/USD pair is most likely to show a downward trend during the week, with no upper shadow on the weekly black (bearish) candle (Monday — down) and the presence of a lower shadow by Friday (Friday — up).
Alternative Scenario
From the level of 1.3355 (closing price of the last weekly candle), the price may continue to move downward toward 1.3044 — a historical support level (light blue dashed line). Upon reaching this level, the price may start moving upward, targeting 1.3141 — the 38.2% retracement level (red dashed line).
*El análisis de mercado publicado aquí tiene la finalidad de incrementar su conocimiento, más no darle instrucciones para realizar una operación.
¡Los informes analíticos de InstaSpot lo mantendrá bien informado de las tendencias del mercado! Al ser un cliente de InstaSpot, se le proporciona una gran cantidad de servicios gratuitos para una operación eficiente.


