




¡Nuestro equipo cuenta con más de 7,000,000 operadores!
Cada día, trabajamos juntos para mejorar las operaciones. Obtenemos grandes resultados y seguimos adelante.
El reconocimiento de millones de operadores en todo el mundo es el mejor agradecimiento a nuestro trabajo! ¡Usted hizo su elección y haremos todo lo que esté a nuestro alcance para satisfacer sus expectativas!
¡Juntos somos un gran equipo!
InstaSpot. ¡Orgulloso de trabajar para usted!





¡Actor, 6 veces ganador del torneo UFC y un verdadero héroe!
El hombre que se hizo a sí mismo. El hombre que sigue nuestro camino.
El secreto detrás del éxito de Taktarov es el constante movimiento hacia el objetivo.
¡Revele todo los lados de su talento!
Descubra, intente, fracase, ¡pero nunca se rinda!
InstaSpot. ¡Su historia de éxito comienza aquí!
The 4-hour (H4) chart for Gold (GOLD) reveals a clear positive shift in price action. The price is currently trading at the 4366.80 level, having successfully broken out of the bearish corrective range and stabilized above it, driven by increased buying pressure.
Technical Reading and Price Action
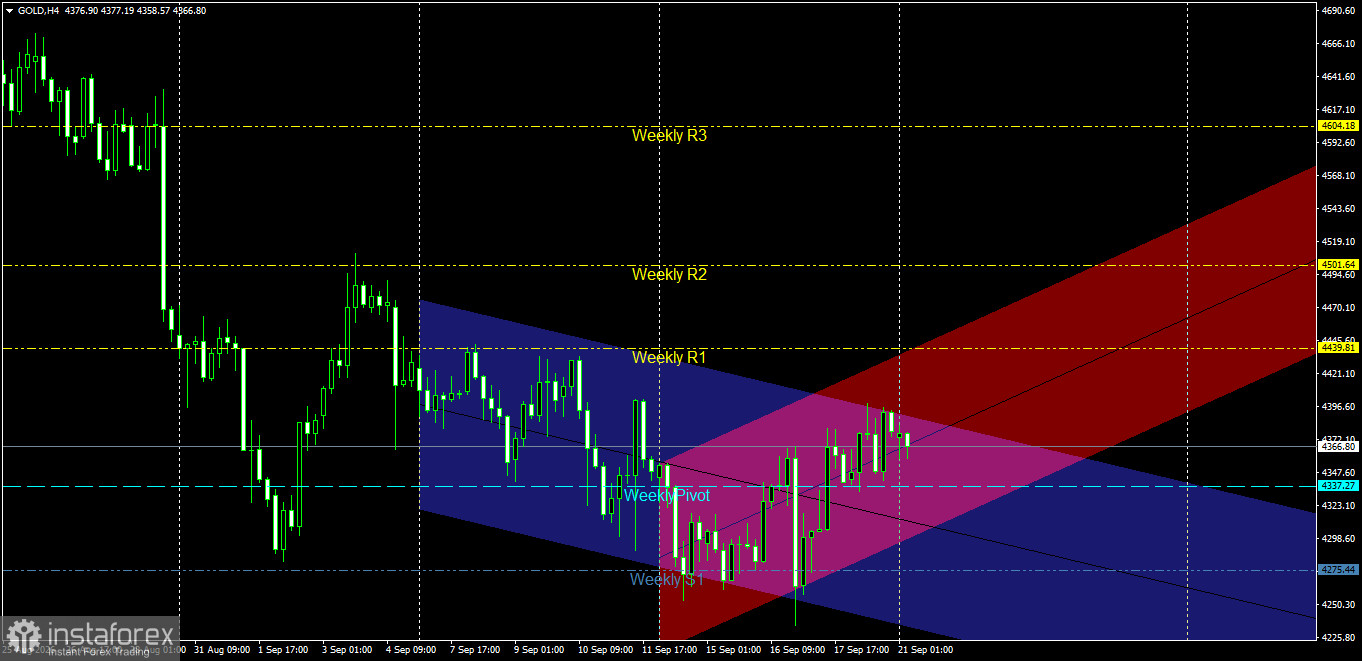
Bullish Channel Structure: Gold is moving within a primary rising channel (blue) and a minor rising channel characterized by accelerating momentum (pink). The price previously surged to record a local high near the first daily resistance level (Daily R1) at 4406.78 before entering a mild bearish correction.
Interaction with Pivot Levels: The price is currently trading below the daily pivot level (4370.30) and is constrained above the monthly pivot level (4387.35)—which has shifted into an intraday resistance—while finding support from below at the weekly pivot level (4337.27) and the first daily support level (Daily S1) at 4341.51.
Key Support and Resistance Levels
Key Resistance Levels:
Resistance 1: The range between 4370.30 and 4387.35 (Daily Pivot and Monthly Pivot).
Resistance 2: The 4406.78 level (Daily R1 and the previous high).
Key Support Levels:
Support 1: The range between 4341.51 and 4337.27 (Daily S1 and Weekly Pivot). Second Support: 4305.03 (Daily S2).
Key Support: 4276.24 (Daily S3).
Price Action Outlook and Trading Recommendations
Bullish Scenario (Primary):
A continuation of the upward trend is the most likely scenario, provided the price remains stable above the 4341.51–4337.27 support range and within the main blue channel.
Recommendation: Buy at current levels or upon a positive rebound from the 4340.00 area.
Technical Targets: Re-breaking the 4370.30 level, then targeting 4387.35 as the first target, and extending toward 4406.78 as the second target.
Stop Loss: A one-hour candle close below the 4330.00 level.
Bearish Corrective Scenario (Alternative):
This scenario is triggered if the price breaks the lower boundaries of the two bullish channels and exits the upward trajectory.
Confirmation Condition: Breaking the weekly pivot level of 4337.27 and closing below it with a full one-hour candle.
Technical Targets: A pullback targeting the next support levels at 4305.03, followed by 4276.24.
Risk Management
It is recommended to monitor price action near the weekly and daily pivot zones for confirmation signals, while strictly adhering to stop-loss levels to protect the portfolio and avoiding risks exceeding 1% to 2% of capital.
*El análisis de mercado publicado aquí tiene la finalidad de incrementar su conocimiento, más no darle instrucciones para realizar una operación.
¡Los informes analíticos de InstaSpot lo mantendrá bien informado de las tendencias del mercado! Al ser un cliente de InstaSpot, se le proporciona una gran cantidad de servicios gratuitos para una operación eficiente.


